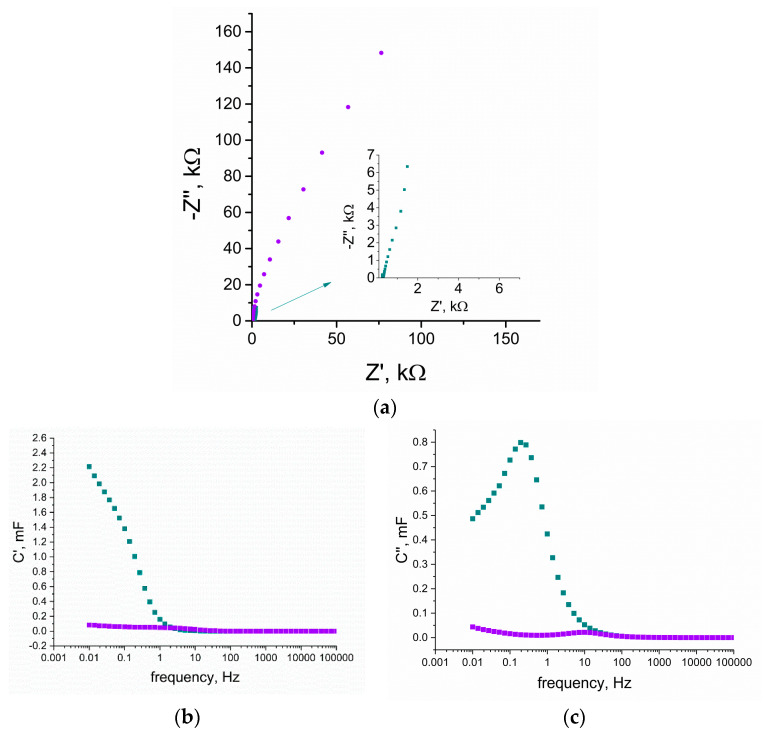
Figure 6.
Comparison of electrochemical properties of anhydrous (violet curves) and hydrous (blue curves) RuO2 tested with the use of electrochemical impedance spectroscopy in the frequency range of 100 kHz and 0.01 Hz with an amplitude of 0.01 V and set potential value of 0.15 V in 0.01 M KCl as electrolyte, (a) electrochemical impedance spectroscopy (EIS) curves of both tested layers, inset: closer look at hydrous RuO2, (b) real part of capacitance (C’) change vs. frequency, (c) imaginary part of capacitance (C”) change vs. frequency.

