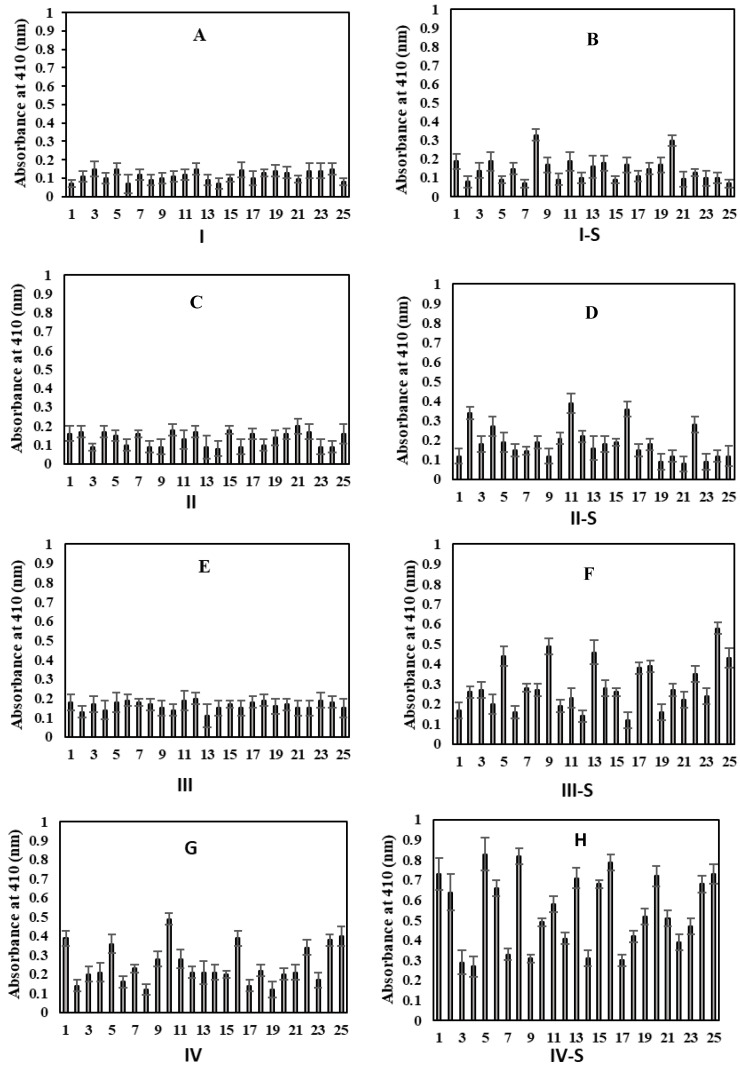
Figure 3.
Direct binding ELISA for serum samples (1:100 diluted) for the detection of serum autoantibodies against Gly-HSA from individuals from various groups. Figures A–H represent; groups (A): I (21–40), (B): I-S (21–40), (C): II (41–60), (D): II-S (41–60), (E): III (61–80), (F): III-S (61–80), (G): IV (>80), and (H): IV-S (>80), respectively. ‘S’ represent subjects who are smokers. Each sample was run in triplicate and data is presented as mean ± SD.

