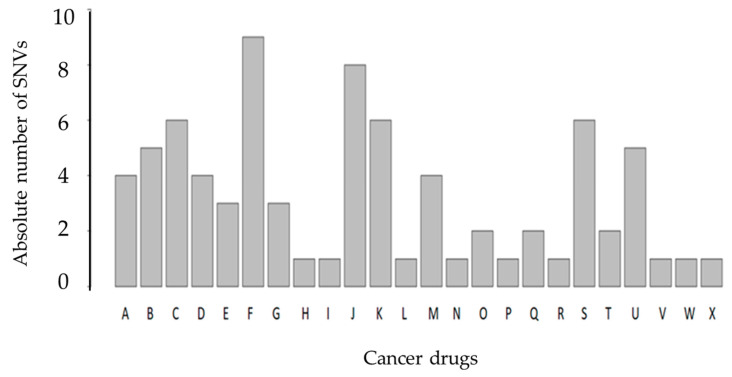
Figure 6.
Bar plot of SNVs associated with known cancer drugs in the PharmGKB database. The PharmGKB database gathers all currently reported variant–drug interactions by at least two different scientific publications. The x-axis illustrates the cancer drugs, anthracyclines (A), capecitabine (B), carboplatin (C), cisplatin (D), cyclophosphamide (E), docetaxel (F), doxorubicin (G), doxorubicinol (H), exemestane (I), fluorouracil (J), gemcitabine (K), imatinib (L), irinotecan (M), letrozole (N), leucovorin (O), lonafarnib (P), methotrexate (Q), oxaliplatin (R), paclitaxel (S), platin compounds (T), thalidomide (U), tipiracil HCL (V), trastuzumab (W), and trifluridine (X). The y-axis is the number of SNVs found associated with each drug. The same SNV can affect the response of different drugs.

