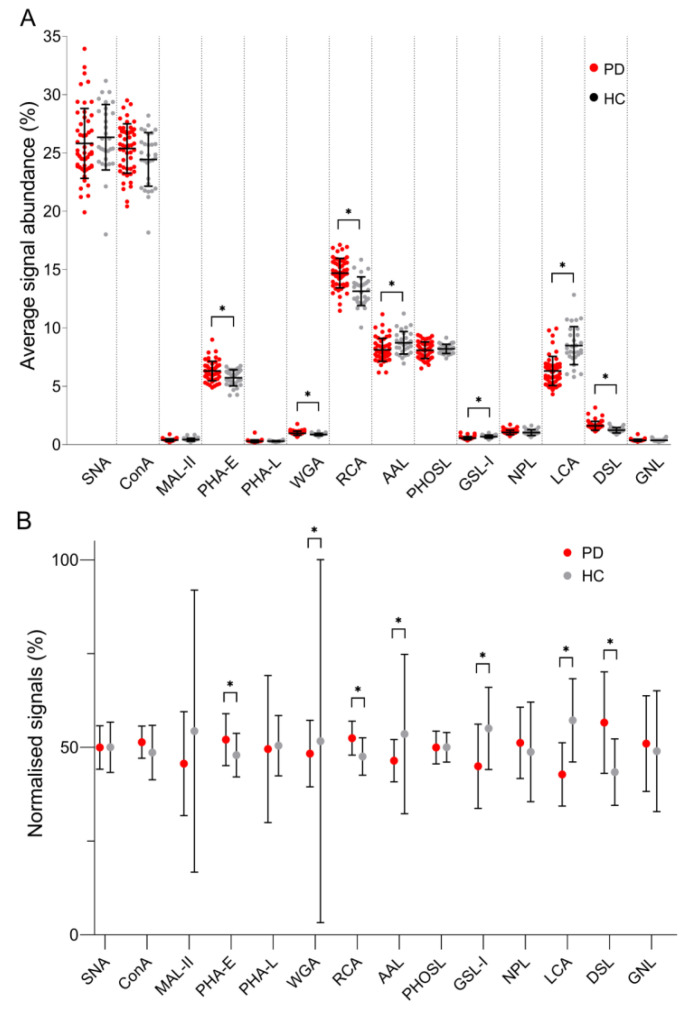
Figure 1.
(A) Relative signal abundances obtained for each lectin used in the lectin-based microarray analysis of fibrinogen samples, (B) the contribution of each group (PD and HC) calculated as the portion of the sum of signals obtained for each lectin. ESRD patients on peritoneal dialysis (PD), healthy controls (HC). Relative abundances are given together with standard deviation, while the Mann-Whitney U test p-value < 0.05 is labelled with “*”.

