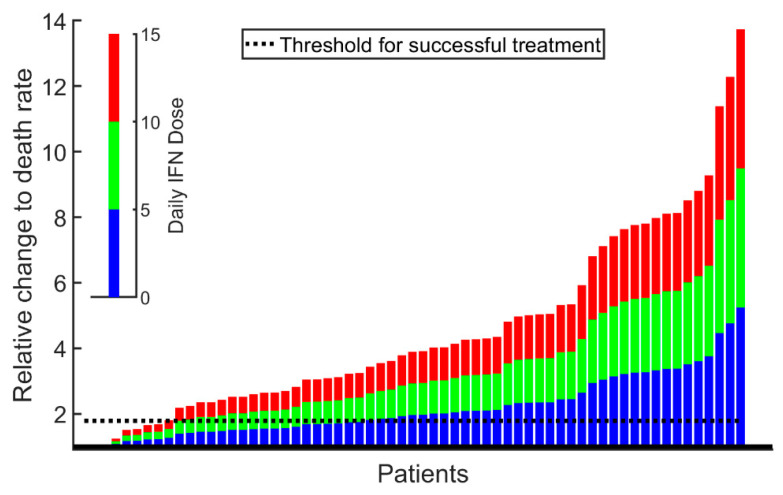
Figure 7.
From the Cancitis model, it can be computed whether the specific patient dose–responses suffice to force the patient towards a healthy or a diseased state (i.e., the cancer is about to be eradicated or the cancer escapes with ensuing disease progression). Each patient prediction in the study is represented by one column. The blue part of the columns depicts if the patient received an average daily dose of 5 µg IFN, the green depicts if the patient received 10 µg IFN per day on average, and the red depicts if the patient received 15 µg IFN per day on average. If the top of the columns are above the black dashed line, corresponding to 1.8-fold increase in the malignant stem cell death rate, the patient is said to respond well to the treatment—i.e., the allele burden steadily declines and so do the leukocyte and thrombocyte counts. For an average daily dose of 15 µg, the model predicts that there are 3 non-responders (not visible) at the left most part of the figure, followed by 6 poor responders. The remaining 54 are good responders. A similar interpretation can be made for an average daily dose of, e.g., 5 or 10 mg IFN. A stratification of the figure into patients receiving Pegasys and PegIntron, respectively, resembles the merged figure but with lower number of patients.

