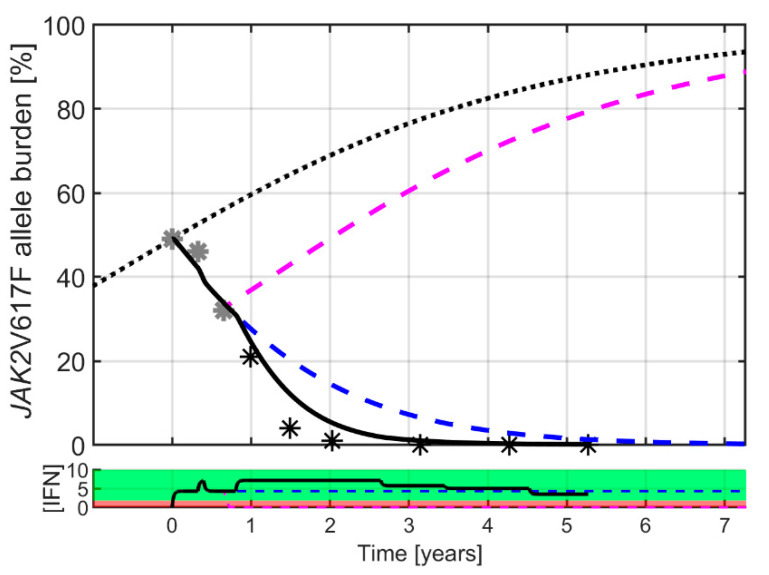
Figure 8.
Different hypothetical modelling treatment scenarios: treatment discontinuation and prolonged treatment, respectively. Pausing the treatment after month 8 predicts a relapse of the cancer, and the pre-treatment JAK2V617F value is reached after 1.6 years (pink dashed curve). In contrast, prolonged treatment suppresses the cancer in the model (black solid curve) even with a lower dose (blue dashed curve). The model average daily IFN dose in µg is indicated in the lower panel, with line colors corresponding to those in the upper panel. Patient-specific model prediction for all patients exposed to hypothetical treatment discontinuation and prolongation, respectively, are depicted in Supplementary Material D.

