
Figure 1. IL23 supports the expansion of T cells in an activation-inducible dependent manner.
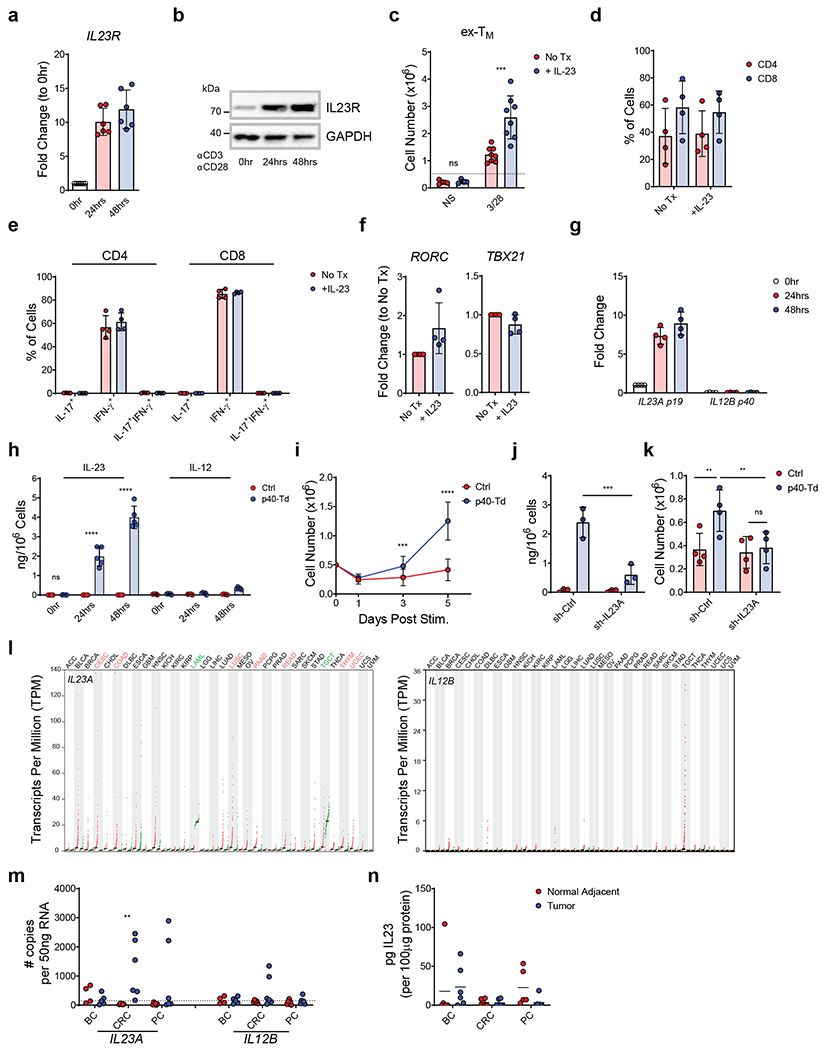
(a,b) IL23R expression at mRNA (a) and protein level (b) measured by qRT-PCR and western blot, respectively in human T cells activated and expanded ex vivo (ex-TM) at time 0, 24, 48 hours after TCR activation. Data are represented as fold change in expression normalized to the housekeeping gene 18S and to the expression at time 0. Data shown are individual values and mean ± SD (n = 6 in (a) and n = 5 in (b)). (c) Expansion of ex-TM cells with or without activation with αCD3 and αCD28 Abs and with or without rIL23 (50 ng/mL). Cell numbers were numerated by flow cytometry at day 7. Data shown are individual values and mean ± SD (n = 4), ***p=0.0002 determined by repeated measured 2-way ANOVA with Sidak post hoc test. (d) Distribution of CD4+ and CD8+ T cells in ex-TM cells activated with αCD3 and αCD28 Abs in the presence or absence of 50 ng/mL rIL23 at day 7. Data shown as mean ± SD (n = 4). (e) Intracellular detection of IFN-γ and IL-17 in CD4+ and CD8+ T cells in ex-TM cells activated with αCD3 and αCD28 Abs in the presence or absence of 50 ng/mL rIL23 for 7 days. Data shown as or individual values, mean ± SD (n = 4). (f) Relative expression of the Th17 and Th1 transcription factor RORγT and Tbet, respectively assessed by qRT-PCR in ex-TM cells activated with αCD3 and αCD28 Abs in the presence or absence of 50 ng/mL rIL23 for 7 days. Data shown as individual values, mean ± SD (n = 4). (g) mRNA expression of the IL23 subunits p19 (IL23A) and p40 (IL12B) in ex-TM cells activated with αCD3 and αCD28 Abs at time 0, 24, 48 hours as determined by qRT-PCR. Data are expressed as fold change in expression normalized to the housekeeping gene 18S and to the expression at time 0. Data shown as individuals and mean ± SD (n = 4). (h) Detection of IL23 secreted by Ctrl cells or p40-Td cells activated with αCD3 and αCD28 Abs for 0, 24 and 48 hours as measured by ELISA. Data shown as individuals and mean ± SD (n = 5). ****p<0.0001 determined by repeated measured 2-way ANOVA with Sidak post hoc test. (i) Numeric expansion of Ctrl cells and p40-Td cells activated with αCD3 and αCD28 Abs. Data shown as mean ± SD (n = 13). ***p=0.0006, ****p<0.0001 determined by repeated measured 2-way ANOVA with Sidak post hoc test. (j) Detection of IL23 secreted by activated Ctrl cells and p40-Td cells co-transduced with either the vector encoding control shRNA (sh-Ctrl cells) or IL23A-shRNA (sh-IL23A). Data shown as individual values and mean ± SD (n = 3). ***p=0.0002 determined by repeated measured 2-way ANOVA with Sidak post hoc test. (k) Cell counts at day 5 of sh-Ctrl cells or sh-IL23A cells activated with αCD3 and αCD28 Abs. Data shown as individual values and mean ± SD (n = 4). **p=0.0069 for Ctrl cells:sh-Ctrl cells vs. p40-Td cells:sh-Ctrl cells and **p=0.0056 for p40:sh-Ctrl cells vs. p40-Td cells:sh-IL23A cells, determined by repeated measured 2-way ANOVA with Sidak post hoc test. (I) Expression (transcript per million) of IL23A (left) and IL12B (right) mRNA in the tumor (red dots) and adjacent normal tissues (green dots) from different cancer patients plotted using TCGA data. Tumor types highlighted in red indicate higher expression in tumor tissues vs. normal tissues, while those highlighted in green indicate lower expression. (m) Expression of IL23A and IL12B genes determined by qRT-PCR in breast cancer (BC), colon rectal cancer (CRC) and pancreatic cancer (PC) and paired adjacent normal tissues. Data are shown as copies of RNA per 50 ng RNA (n = 6). Dotted line indicates the detection limit of the qRT-PCR assay used (CT > 35). **p=0.0019 was determined by 1-way ANOVA with Sidak post hoc test. (n) Detection of IL23 by ELISA in the supernatant of single cell suspension of paired tumors and adjacent normal tissues. Data are shown as pg of IL23 per 100 μg supernatant protein input, individual values and mean ± SD (n = 6).