
Figure 5. p40 expression enhances the anti-tumor activity of T cells in syngeneic tumor models.
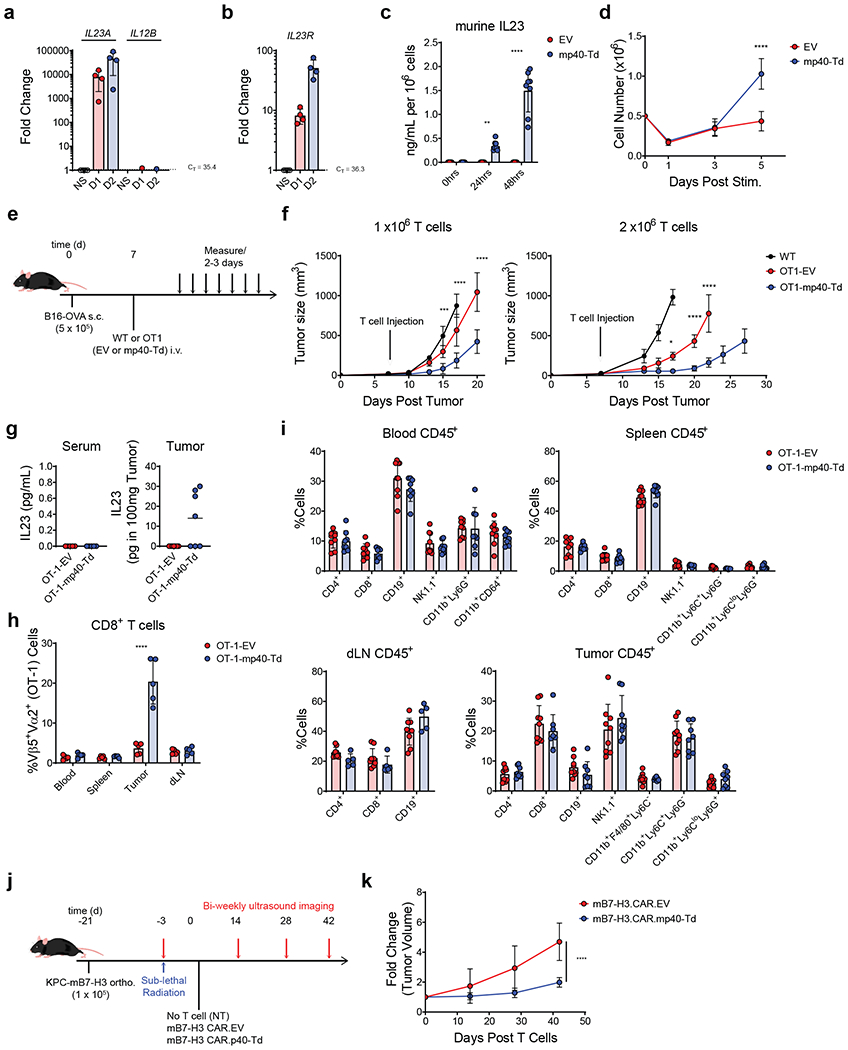
(a-b) Expression of IL23A, IL12B (a) and IL23R (b) genes determined by qRT-PCR in ex vivo activated and expanded murine splenic T cells after re-stimulation with αCD3 and αCD28 Abs for 0, 24 and 48 hours. Data shown as fold change in gene expression normalized to the housekeeping gene CD3E and to the value at time 0. Data shown are individual values and mean ± SD (n = 4). (c) Measurement of murine IL23 released by murine splenic T cells transduced either with the empty vector (EV) or the vector encoding murine IL12B gene (mp40-Td) and re-stimulated with αCD3 and αCD28 Abs for 0, 24 and 48 hours. Data shown are individual values and mean ± SD (n = 8). (d) Cell counts of EV and mp40-Td murine T cells at day 1, 3 and 5 after re-stimulation with αCD3 and αCD28 Abs. Data shown are mean ± SD (n = 3). ****: p<0.0001 determined by repeated measured 2-way ANOVA with Sidak post hoc test. (e) Schematic representation of the syngeneic B16 melanoma model. (f) Measurement of the tumor volume post tumor engraftment. Data shown as mean ± SD of 2 independent experiments. For experiment with 1 × 10⁶ T cells, n = 5 mice/group for WT cells and n = 8 mice/group for OT1-EV cells and OT1-mp40-Td cells. For experiments with 2 × 10⁶ T cells, n = 6 mice/group for WT cells and OT1-EV cells and n = 7 mice/group for OT1-mp40-Td cells. *: p=0.0182; ***: p=0.0007; ****:p<0.0001 determined by 2-way ANOVA with Sidak post hoc test. (g) Detection of murine IL23 in the serum and tumor supernatant collected 14 days after T cell infusion. Data shown as individual values and mean (n = 5 mice/group for serum and n = 7mice/group for tumor). (h) Frequency of OT1 TCR+ (Va2+Vb5+) cells within the CD8+ T cells in the tissues collected from treated mice. Data shown as mean ± SD (n = 5 mice/group). ****p<0.0001 determined by 2-way ANOVA with Sidak post hoc test. (i) Immune composition of the peripheral blood, spleen, draining lymph nodes (dLN) and tumor at the time of euthanasia. Data shown as individual values and mean ± SD of 2 independent experiments (n = 9 mice/group). (j) Schematic representation of the syngeneic PDAC orthotopic model. Murine cell line KPC-4662 engineered to express murine B7-H3 (KPC-mB7-H3) was implanted (0.1 × 10⁶ cells/mouse) into the pancreas of 6 week old C57BL/6 mice. Eighteen days post tumor cell implantation, mice were irradiated with 400 cGy and 3 days later infused i.v. with syngeneic B7-H3.CAR.EV cells (1 × 10⁷ cells/mouse) or B7-H3.CAR.mp40-Td cells (1 × 10⁷ cells/mouse). Tumor growth was monitored by US. (k) Summary of the fold change (compared to day 0) in tumor volume from 2 independent experiments (n = 8 mice/group). ****p <0.0001 determined by 2-way ANOVA with Sidak post hoc test between B7-H3.CAR.EV cells vs B7-H3.CAR.mp40-Td cells at day 42.