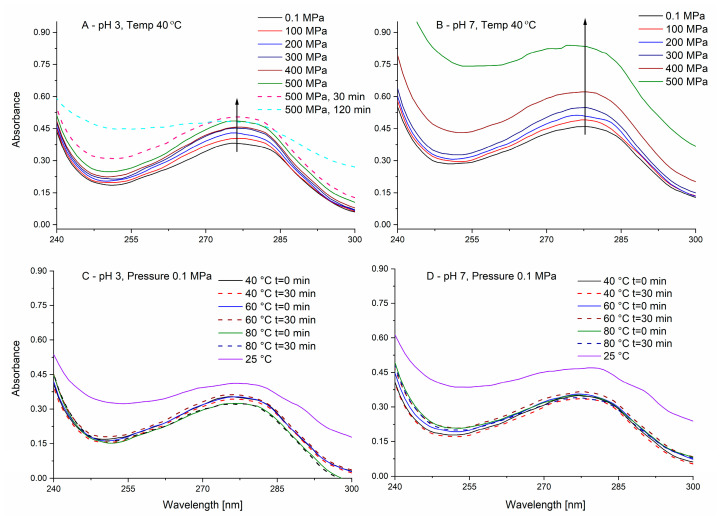
Figure 3.
Averaged UV absorbance of potato protein isolate (PPI) (0.05% w/w) during pressure (A,B) and thermal (C,D) treatments at pH 3 (A,C) and pH 7 (B,D). Full lines represent the absorbance immediately after pressure or temperature increase, while the dashed lines represent the absorbance after different times as described in the legend. The arrows are to guide the eye for changes occurring with increasing pressure.

