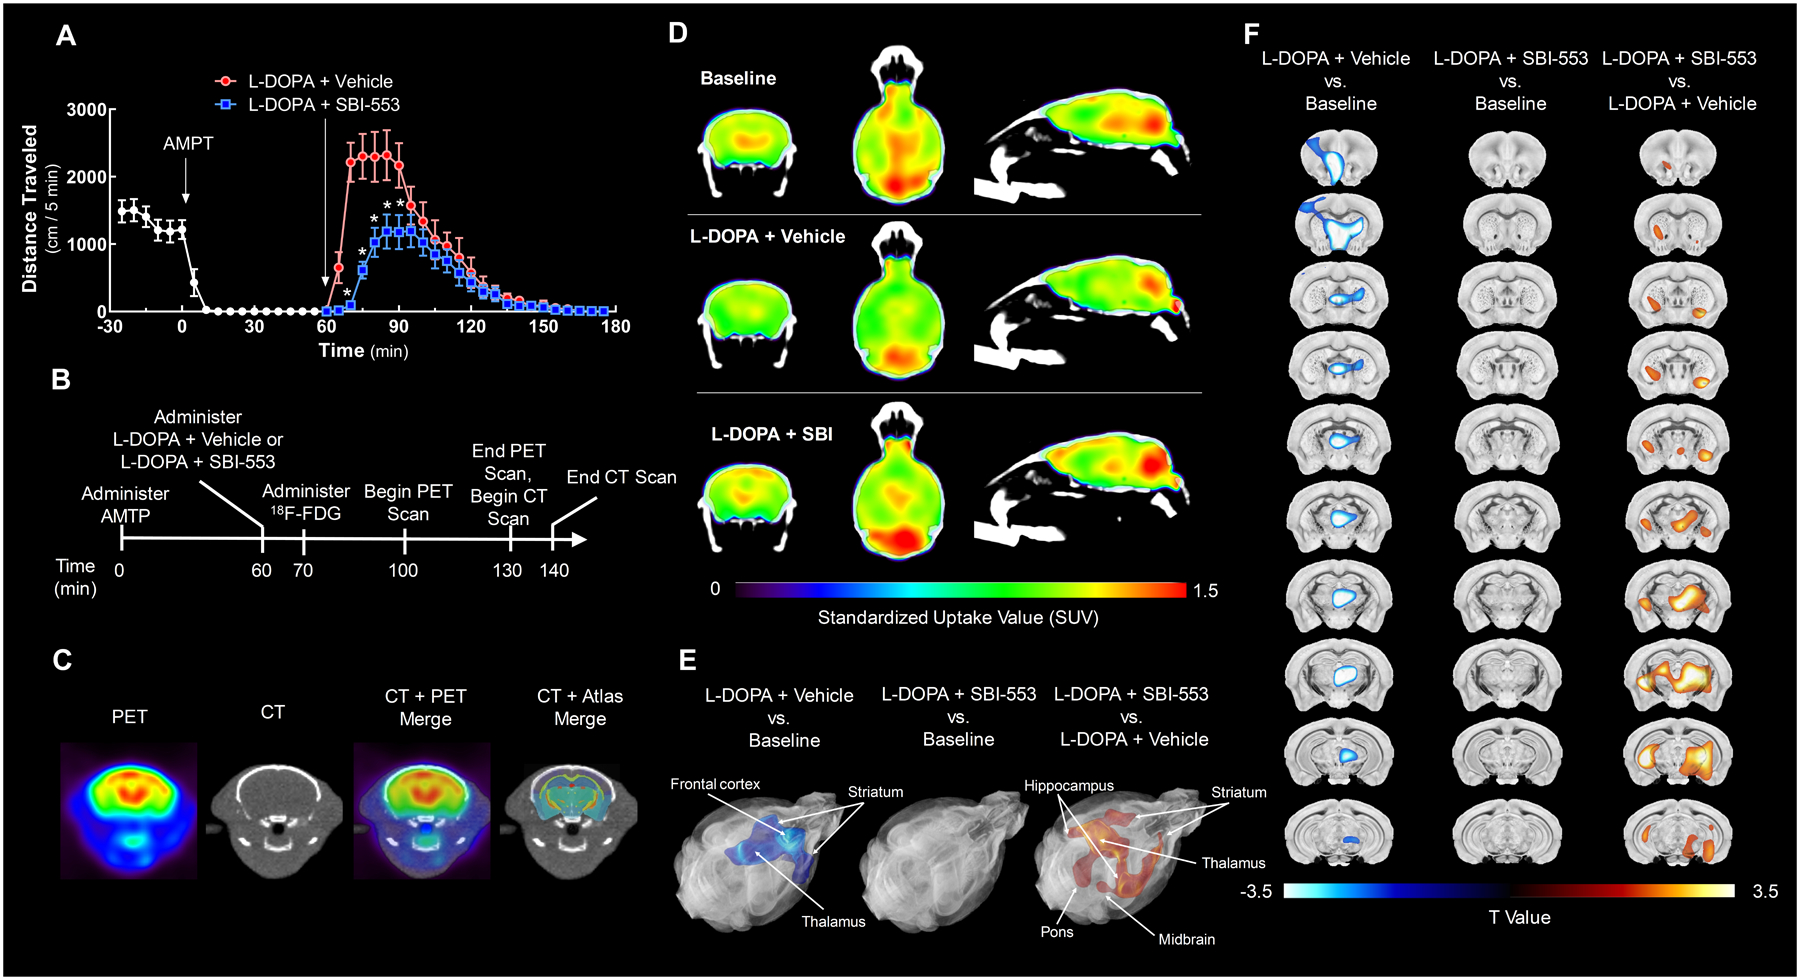
Figure 4. SBI-553 attenuates L-DOPA-induced changes in regional brain glucose utilization.

The ability of SBI-553 to modulate L-DOPA-induced changes in [18F]-FDG uptake was evaluated in dopamine-depleted dopamine transporter knockout (DAT KO) mice by PET/CT.
(A) Open field activity of DAT KO in the model of dopamine-induced locomotion used for imaging studies. DAT KO mice received the tyrosine hydroxylase inhibitor α-methyl-p-tyrosine (AMPT, 12 mg/kg, i.p.) 60 min prior to co-administration of L-DOPA (25 mg/kg, i.p.) and vehicle (saline, i.p.) or L-DOPA and SBI-553 (12 mg/kg, i.p.).
(B) Timeline indicating the schedule of treatments and scan acquisitions.
(C) Representative images showing registration of a PET to a CT scan and a CT scan to the 3-dimensional brain atlas with 332 regional labels.
(D) [18F]-FDG PET/CT scans from a representative animal acquired at baseline (top), after L-DOPA and vehicle co-treatment (middle), or after L-DOPA and SBI-553 co-treatment (bottom) are shown in coronal (left), transverse (middle) and sagittal (right) sections. Position relative to bregma: anteroposterior, −1.31 mm; mediolateral +0.05 mm; dorsoventral, +3.37 mm.
(E,F) [18F]-FDG uptake was compared among groups using statistical parametric mapping (SPM). This voxel-based analysis revealed a single cluster of significantly reduced 18F-FDG standardized uptake values (SUVs) in the L-DOPA + Vehicle versus (vs.) Baseline comparison (left; kE = 330,117 voxels, pcluster-level = 0.049; peak-level T = 7.40, peak-level Z = 3.60, peak-level <0.0001). No significant clusters were identified in the L-DOPA + SBI-553 vs. Baseline comparison (middle). A single cluster of significantly elevated SUVs was identified in the L-DOPA + SBI-553 vs. L-DOPA + Vehicle comparison (right; kE = 419,788 voxels, pcluster-level = 0.042; peak-level T = 7.74, peak-level Z = 3.67, ppeak-level <0.0001). T Maps of significantly reduced (blue) and increased (orange) voxels are shown in the brain atlas as (E) rendered 3-dimensional surfaces and (F) coronal sections. Position of coronal sections relative to bregma along anteroposterior axis: +1.51, +0.61, +0.21, −0.19, −0.63, −1.03, −1.43, −1.83, −2.23, −3.23, −3.83 mm.
For details on statistical comparisons, see Table S4. Also see Figure S3.
