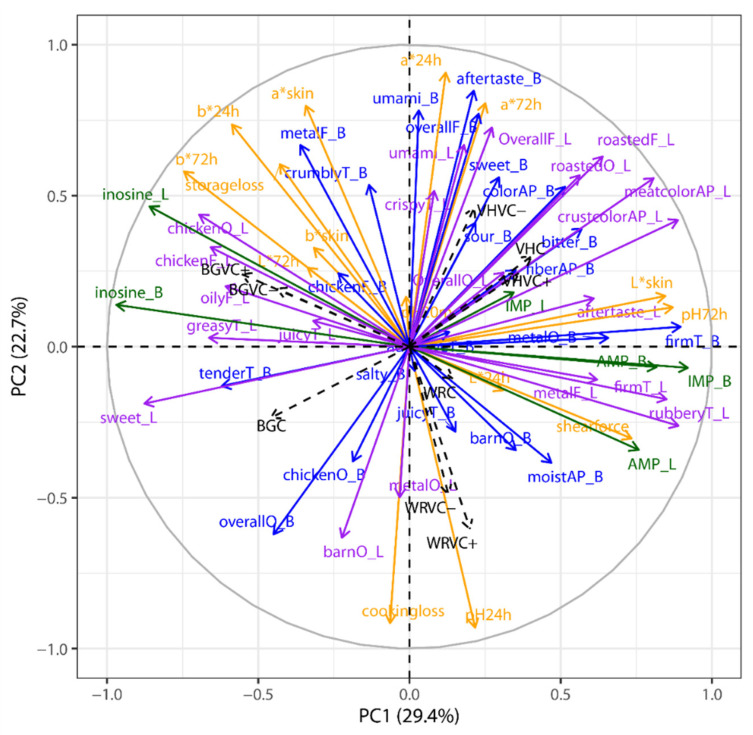
Figure 2.
PCA loading plot showing the correlation of all physicochemical meat quality parameters, sensory variables, and nucleotide levels. Per group (breed type × feed type, n = 9) arithmetic means were used and standardized across groups such that correlations instead of co-variance are used for the PCA.

