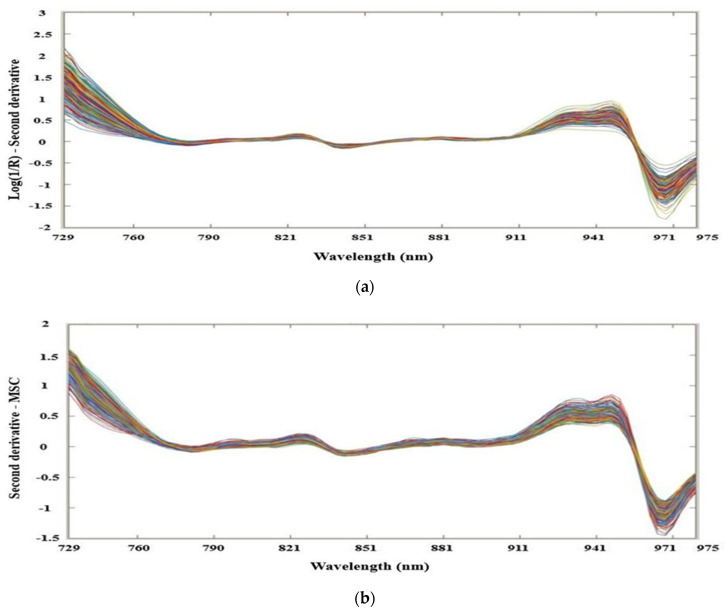
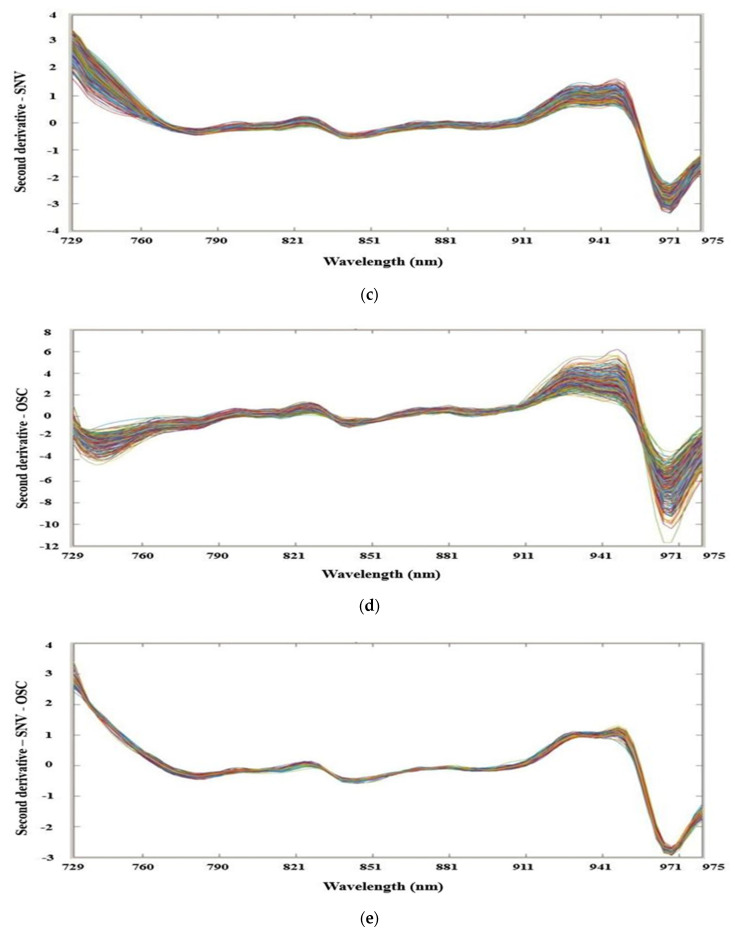
Figure 1.
(a) Second derivative (SD) spectra; (b) spectra by SD + MSC; (c) spectra by SD + SNV; (d) spectra by SD + OSC; (e) spectra by the combination of SD, standard normal variate (SNV), and orthogonal signal correction (OSC); (f) spectra by the combination of SD, multiplicative signal correction (MSC), and SNV; (g) spectra by the combination of SD, MSC, and OSC; and (h) spectra by the combination of SD and Autoscale, from hardy kiwi samples.


