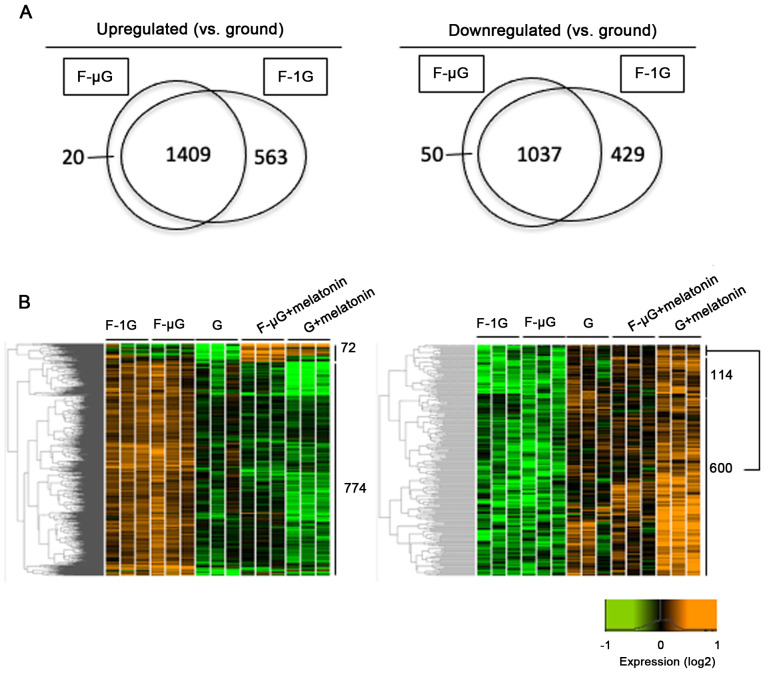
Figure 3.
Venn diagrams and hierarchical clustering of identified differentially expressed transcripts in goldfish scales. (A) Venn diagrams of upregulated and downregulated transcripts between the G group and space flight samples F-µG or F-1G. (B) Heatmaps of the differentially expressed transcripts identified from G, F-µG, F-1G, G + melatonin and F-µG + melatonin groups. The color spectrum (green to orange) represents the log2 expression values scaled between-0.66 and 0.66 (low to high expression). G, ground samples; F-µG, space flight samples in the presence of microgravity; F-1G space flight samples in the absence of microgravity.

