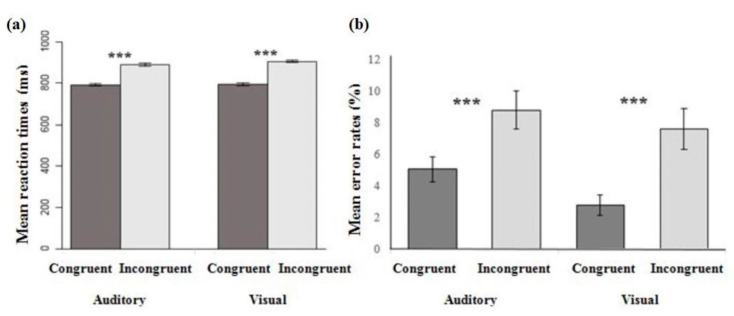
Figure 2.
Mean reaction times (RTs) (a) and mean error rates (b) in response to the visual and auditory stimuli as a function of the congruency of the interaction. Error bars represent the standard error of the mean across participants and the asterisks indicate significant statistical differences (p < 0.001).

