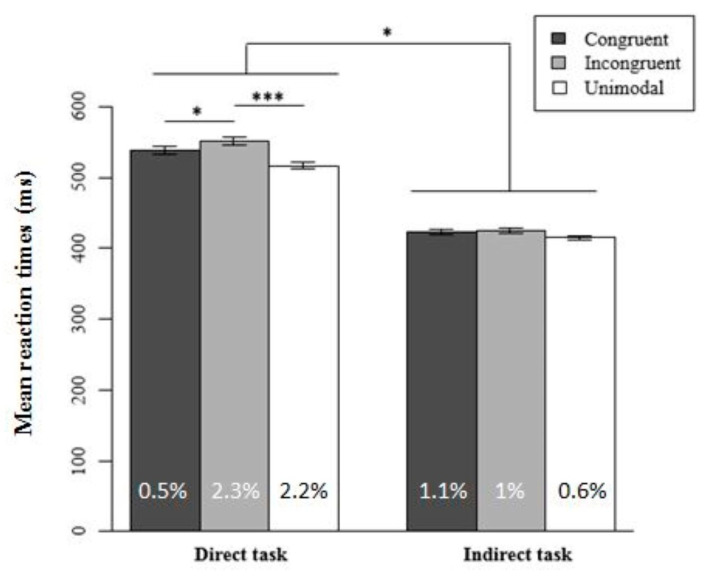
Figure 4.
Mean reaction times as a function of the task and the congruency of the interaction for the pitch–size correspondence. Direct task: N = 23. Indirect task: N = 18. The mean percentage of errors for each condition is shown at the bottom of each column. Error bars represent the standard error of the mean across participants and the asterisks indicate significant statistical difference (* p < 0.05, *** p < 0.001).

