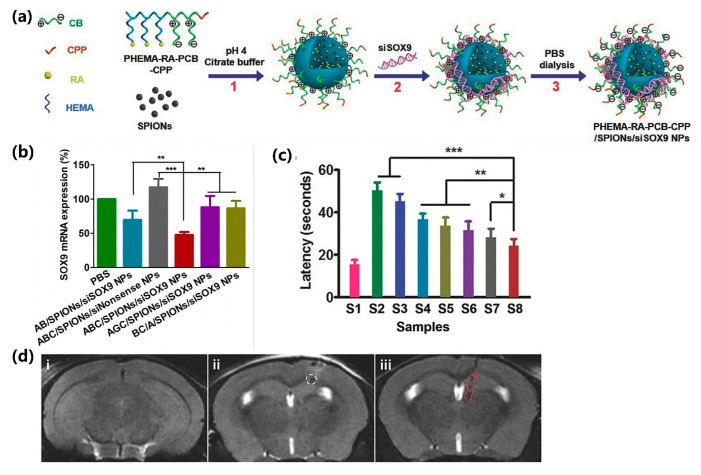
Figure 5.
(a) Preparation of siRNA-RA NPs. (b) Knockdown the expression level of SOX-9 mRNA. (c) The latency in target quadrant in Morris water maze (MWM). (d) Representative in vivo T2 MRI images of brains with PHEMA-RA-PCB-CPP/SPIONs/siSOX-9 NPs. (S1) wild, (S2) PBS, (S3) NSCs alone, (S4) PHEMA-RA-PCB-CPP/SPIONs/si-nonsense NPs NSCs, (S5) PHEMA-PCB-C PP/RA/SPIONs/siSOX-9 NPs NSCs, (S6) PHEMA-RA-PEG-CPP/SPIONs/siSOX-9 NPs NSCs, (S7) PHEMA-RA-PCB/SPIONs/siSOX-9 NPs NSCs, and (S8) PHEMA-RA-PCB-CPP/SPIONs/siSOX-9 NPs NSCs. * p < 0.05, ** p < 0.01, and *** p < 0.005 (n = 5) versus control. Reproduced from “Traceable Nanoparticle Delivery of Small Interfering RNA and Retinoic Acid with Temporally Release Ability to Control Neural Stem Cell Differentiation for Alzheimer’s Disease Therapy”, with permission from John Wiley and Sons, 2016.

