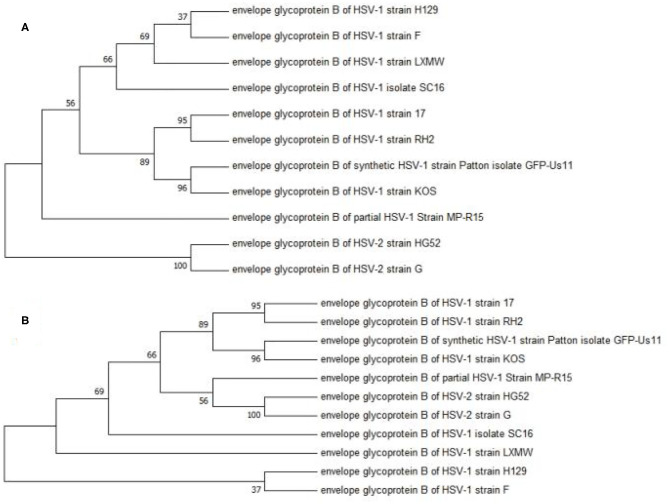
Figure 1.
Phylogenetic analysis of the gBs of 11 HSV strains. This phylogenetic tree was generated by the neighbor-joining (NJ) method using MEGA7. The percentage of trees in which the associated taxa were clustered together is displayed next to the branches. The cladogram with the highest log likelihood is displayed. (A) The evolutionary tree is drawn to scale, with branch lengths measured in number of substitutions per site. (B) The bootstrap consensus tree is taken to represent the evolutionary history of the taxa analyzed. Our result showed an average distance of about 69% among the strains.

