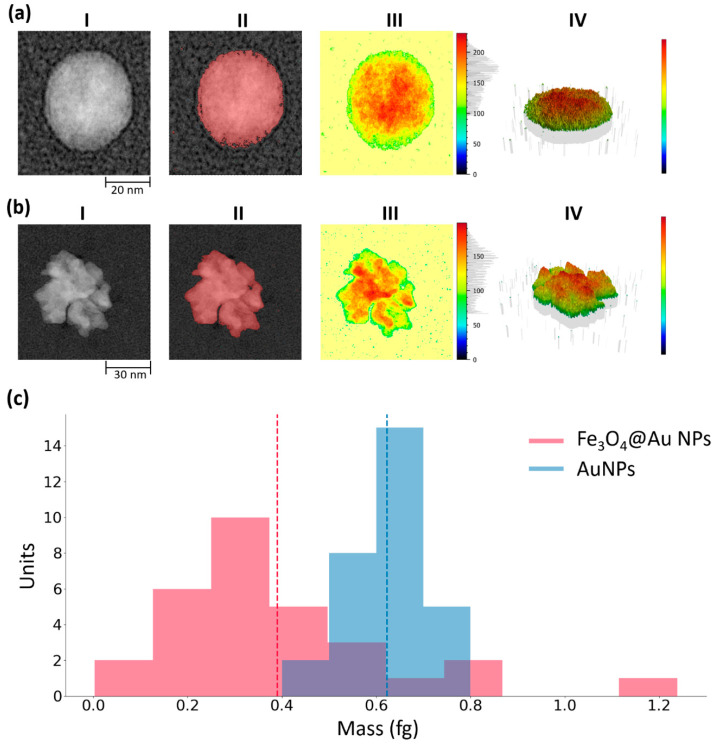
Figure 2.
The steps of the protocol employed to estimate the mass of AuNPs (a) and Fe3O4@Au NPs (b) using the software SPIP Mountains 8. The nanoparticle of interest was considered and extracted from the collective TEM micrograph (I), the contour of the nanoparticles was detected and distinct by the background (II), then particle surface (III) and its 3D rendering (IV) were generated. The latter was employed to estimate the volume of the object. (c) Mass distribution of AuNPs and Fe3O4@Au NPs (core-shell NPs). The mean and the standard deviation for the mass distributions were 0.4 ± 0.2 fg for Fe3O4@Au NPs and 0.63 ± 0.09 fg for AuNPs. Each nanoparticle employed for the mass analysis was extracted randomly from collective TEM micrographs.

