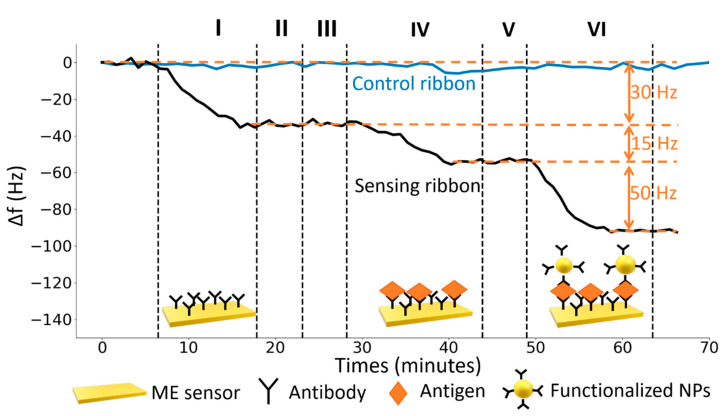
Figure 4.
Typical dynamic response of the ME biosensor. On the y axis the shift of the resonance frequency due to the mass loading and on the x axis the time interval. The black line represents the response of the sensing ribbon in each of the following steps: (I) functionalization with a solution of 25 µg∙mL−1 of UV-activated antibodies, (II) rinse with MilliQ water, (III) flowing of bovine serum albumin solution (50 μg∙mL−1), (IV) flowing of target antigen solution (5 μg mL−1), (V) rinse with MilliQ water, (VI) amplification with core-shell magnetic NPs (Fe3O4@Au). The control ribbon, that was employed to estimate the noise level, is represented by a blue line.

