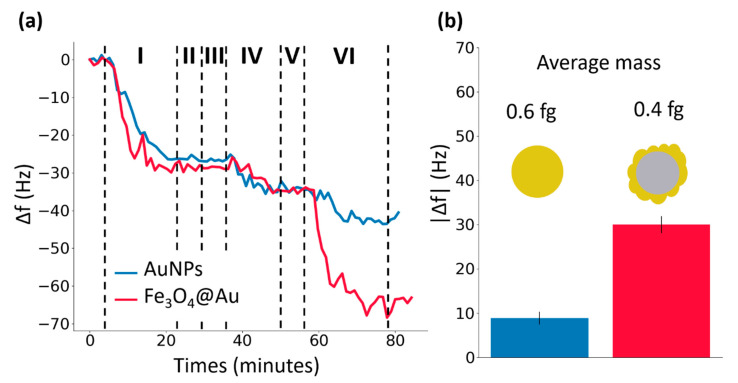
Figure 5.
Comparison between the amplification effects due to AuNPs and core-shell magnetic NPs. (a) The blue and the red lines represent the response of the sensing ribbon to the following steps: (I) functionalization with 25 µg∙mL−1 of UV-activated antibodies (anti-human IgG) which causes a shift of the resonance frequency Δf ≃ 30 Hz; (II) rinse with MilliQ water; (III) flowing of bovine serum albumin solution (50 μg∙mL−1); (IV) exposure to the antigen solution (human IgG) which causes a shift Δf ≃ 10 Hz; (V) rinse with MilliQ water; (VI) amplification with AuNPs for the blue line and amplification with core-shell magnetic NPs for the red line. The former causes a shift Δf = 9 ± 1 Hz while the latter causes a shift Δf = 30 ± 2 Hz. (b) A direct comparison between the amplification of the response signal due to AuNPs (blue) and core-shell magnetic NPs (red).

