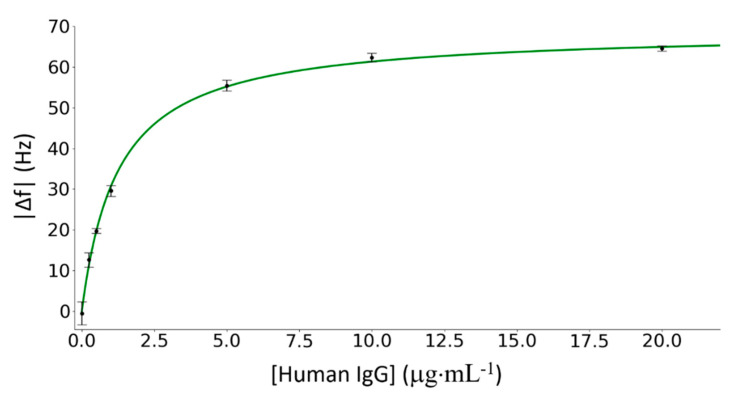
Figure 6.
Dose–response curve, i.e., resonance frequency shifts versus human IGg concentrations. Experimental data are fitted by Langmuir isotherm curve (Equation (5)). The range of tested concentrations varies from the zero concentration to 20 μg∙mL−1. Each concentration has been tested using different ribbons.

