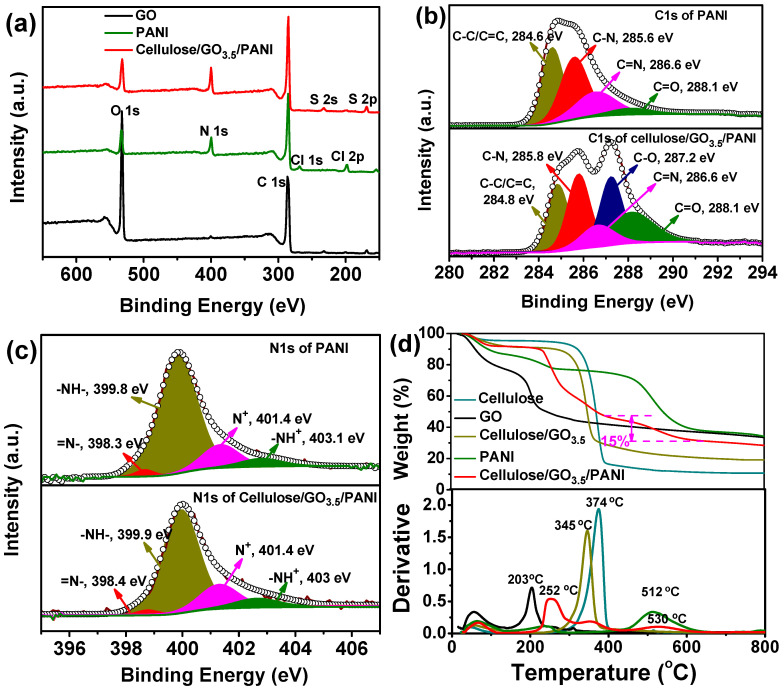
Figure 3.
(a) X-ray photoelectron spectroscopy (XPS) survey spectra of the pristine GO, neat PANI, and the cellulose/GO3.5/PANI composite. (b) Comparison of C 1s spectra of PANI and the cellulose/GO3.5/PANI composite. (c) N 1s spectra of the cellulose/GO3.5/PANI composite and pure PANI. (d) Thermogravimetric analysis (TGA) pattern of pure cellulose, GO, PANI, cellulose/GO3.5, and cellulose/GO3.5/PANI samples.

