Figure 6.
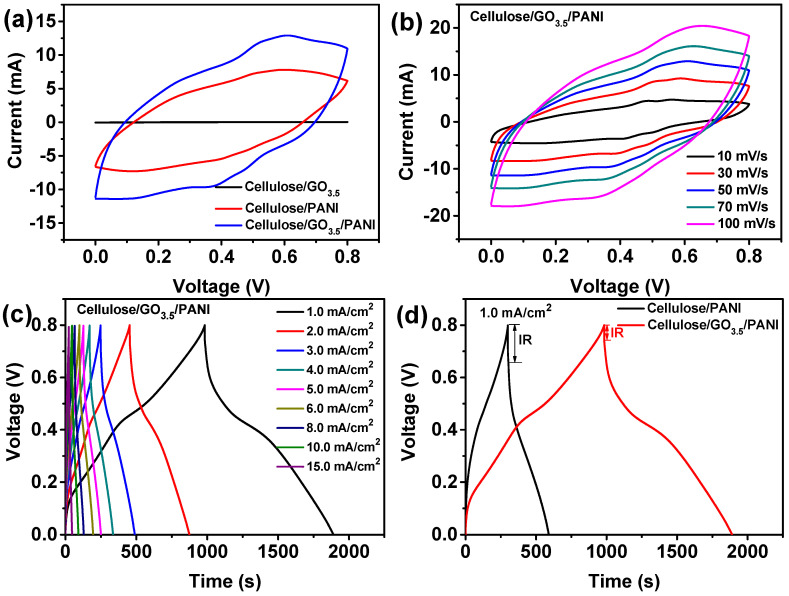
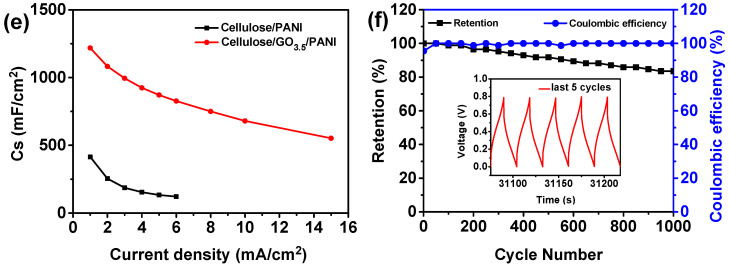
(a) Typical cyclic voltammogram (CV) curves of the cellulose/GO3.5, cellulose/PANI, and cellulose/GO3.5/PANI electrodes at 50 mV/s. (b) CV profiles of the cellulose/GO3.5/PANI electrode at various sweep rates. (c) Galvanostatic charge–discharge (GCD) curves of the cellulose/GO3.5/PANI electrode at different current densities. (d) Comparative GCD curves of cellulose/PANI and cellulose/GO3.5/PANI at a current density of 1.0 mA/cm2. (e) Plots of areal specific capacitance vs. current density. (f) Cyclic stability and Coulombic efficiency (η) of the cellulose/GO3.5/PANI electrode at a current density of 15 mA/cm2. The inset demonstrates the GCD curve for the last five cycles.


