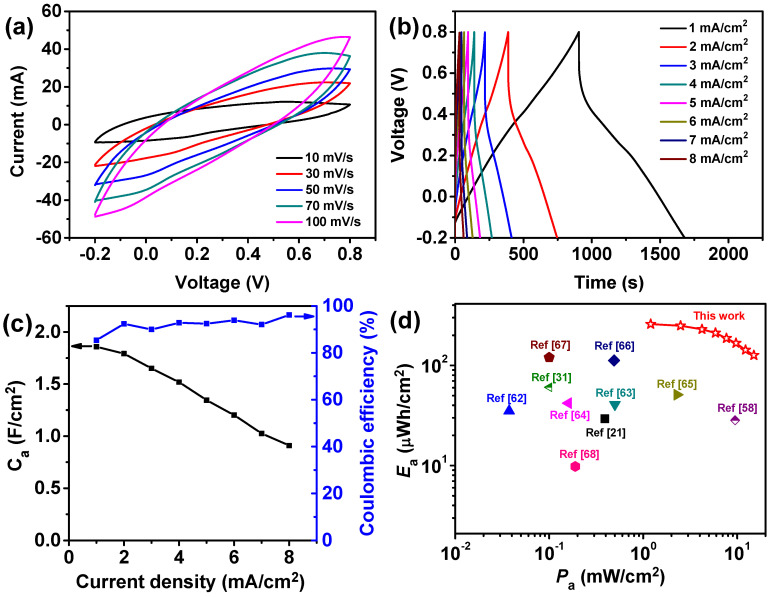
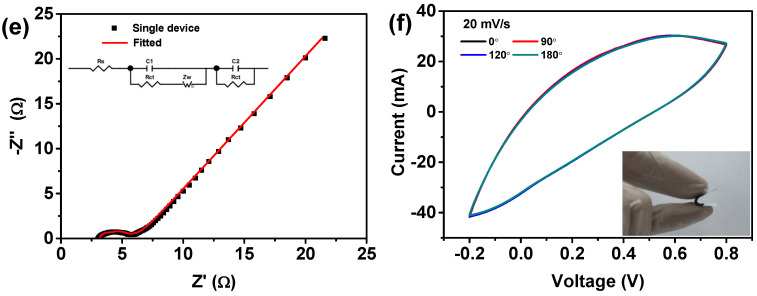
Figure 7.
(a) Typical CV curves of the assembled supercapacitor at different scan rates. (b) GCD curves of the single device at different current densities. (c) The areal capacitance varied with different current densities. (d) Ragone plots and comparisons with those of the reported solid-state supercapacitors. (e) Nyquist plot of the supercapacitor with an equivalent circuit in the inset. (f) CV profiles of the device at flat and at 90°, 120°, and 180° bending deformations.


