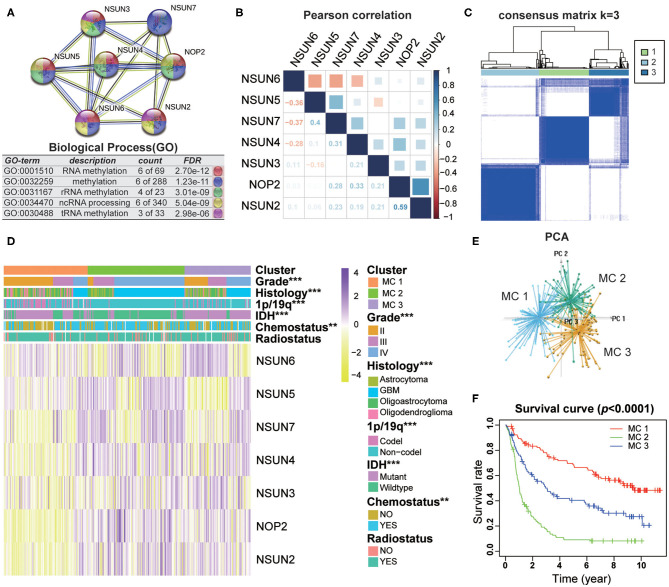
Figure 2.
Interaction and unsupervised consensus analysis of selected RNA:m5C methyltransferases. (A) The function and interaction of seven RNA:m5C methyltransferases. (B) Pearson correlation analysis of seven RNA:m5C methyltransferase expression profiles in the CGGA dataset. (C) Consensus clustering matrix for the most suitable k = 3. (D) The relationship between the RNA:m5C methyltransferase expression profiles of these three subtypes and clinicopathological features of gliomas. (E) Principal component analysis (3D) of the CGGA RNA-sequence profiles. (F) Kaplan-Meier overall survival curves for the glioma patients of three subtypes in the CGGA dataset. Significance: *P < 0.05, **P < 0.01, ***P < 0.001.

