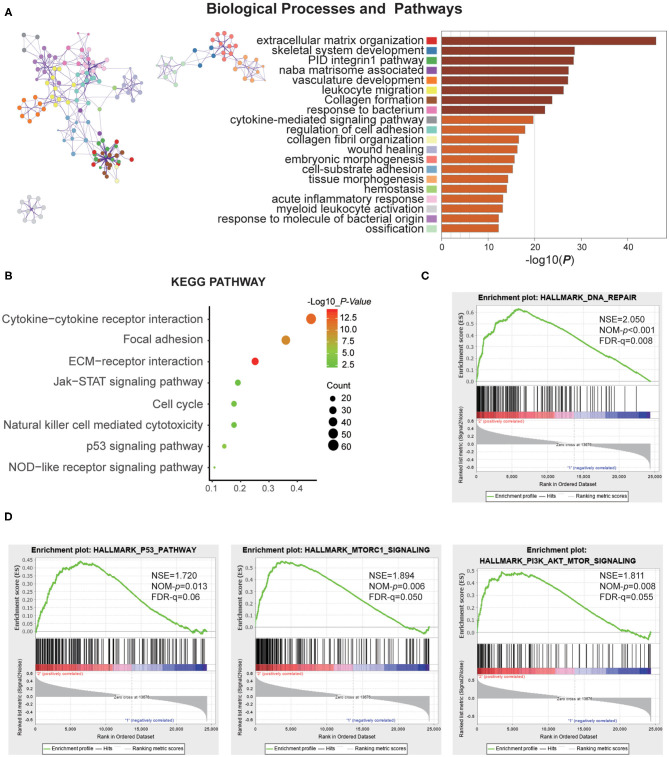
Figure 3.
Function annotation of specific genes of the MC2 subtype. (A) Network and bar chart of 20 significantly enriched biological processes of up-regulated genes in the MC2 subtype. Each enriched node is presented in a different color. (B) KEGG pathway analysis of up-regulated genes in the MC2 subtype. (C,D) GSEA analysis of the MC2 subtype showed enrichment for various hallmarks of tumors.

