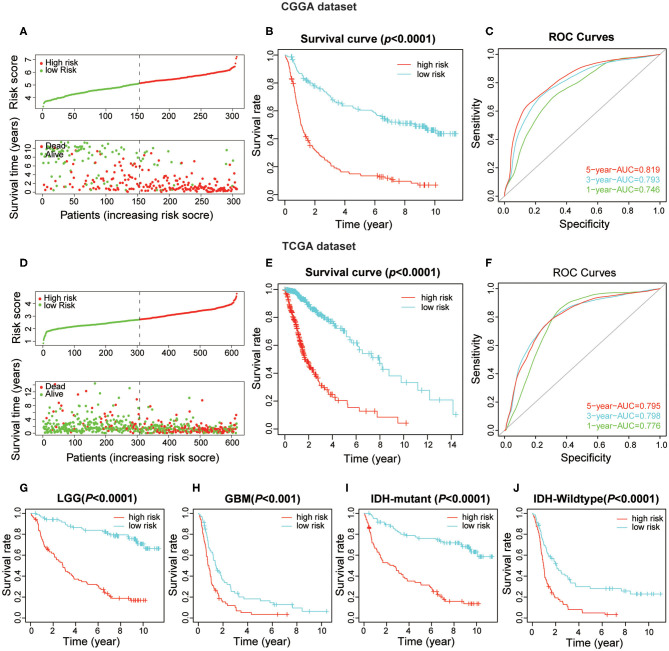
Figure 5.
The prognostic value of the risk score signature both in CGGA and TCGA datasets. (A) The patients with high-risk scores were correlated with a higher death rate and shorter survival time in gliomas. (B) Kaplan-Meier overall survival curves for patient data in the CGGA dataset. (C) The area under the curve (AUC) of ROC curves were 0.819, 0.793, and 0.746 in predicting 5-, 3-, and 1-year OS events from the CGGA dataset, respectively. (D–F) Validation of the risk score signature in the TCGA dataset using the same analysis. (G–J) Kaplan-Meier overall survival curves for patients in the CGGA dataset stratified by WHO grade and IDH-mutant status.

