
Figure 1.
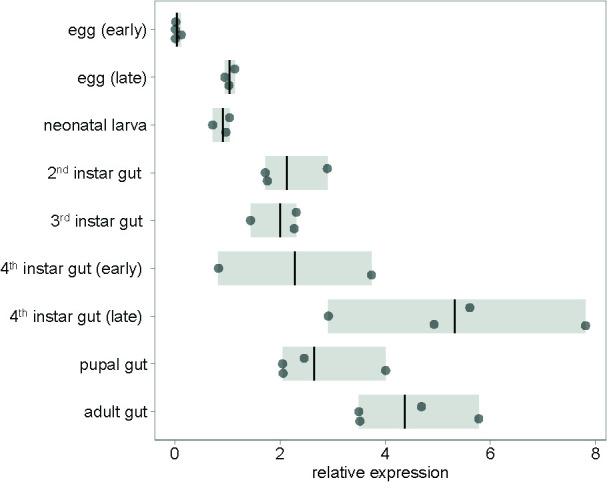
Expression of mesh at different CPB developmental stages. Gene expression values are shown relative to early egg sample average. In the eggs and neonatal larval stages, entire organisms were sampled, whereas in later stages, only guts were sampled. Bars show the range of data and lines shown the mean.