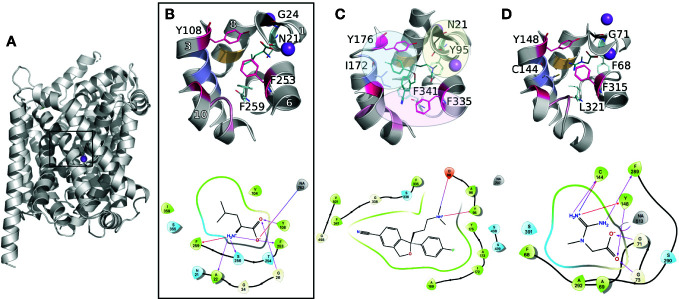
Figure 2.
Conserved binding site organization of the SLC6 family. Binding sites comparisons between LeuT and representative human members of the MATs and GATs subgroups. The proteins are shown in gray cartoons with Na+ and Cl− ions as purple and green spheres, respectively. The key amino acids constituting the binding site are labeled and shown in lines with the following color code: conserved gates are shown in pink; residues anchoring the ligands in black and cyan (TM1 and 6); amino acids involved in substrates specificities are shown in light pink, purple, and orange (TM10, 3, and 8 respectively). Finally, the bound ligands are shown in teal lines. For each complex, the 2D representation are shown in the bottom panel. The 3D representations have been generated with Pymol (Schrodinger), and the 2D with Maestro (Schrödinger, 2019). (A) Three-dimensional structure of LeuT (PDB ID 2A65 (Yamashita et al., 2005)) bound to Leucine. The black square locates the binding site. (B) A close up of LeuT binding site is shown, with the helices numbers indicated in white. (C) Binding site of the crystallographic structure of hSERT (PDB ID 5I73 (Coleman et al., 2016b)) bound to escitalopram. The subpockets A, B, C as reported in literature (Navratna and Gouaux, 2019; Cheng and Bahar, 2019) for the monoamine subgroup are represented with yellow, blue, and pink spheres, respectively. (D) Binding site of a homology model of the creatine transporter (Colas et al., 2020).

