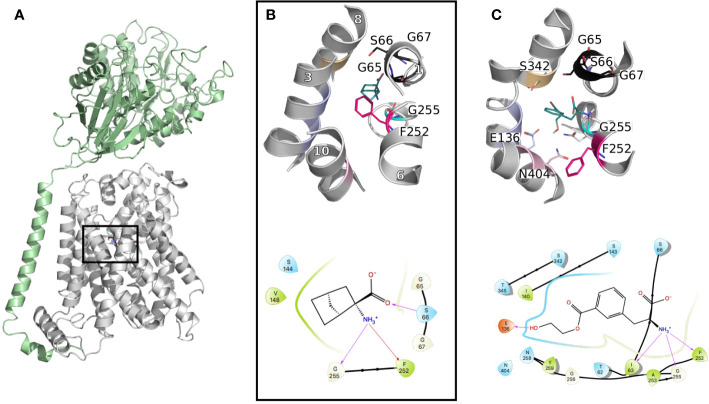
Figure 3.
LAT1 binding site. (A) The cryo-electron microscopy (EM) structure of the LAT1-4F2hc complex (PDB ID 6irt (Yan et al., 2019)) is represented in cartoon. 4F2hc is shown in green and LAT1 bound to 2-amino-2-norbornanecarboxylic acid in gray, from a side view, parallel to the membrane plane. (B) Close up representation of the binding site from a top view. Important residues defining the binding site are labeled and shown in lines with the same color code as in Figure 1, and the helices are labeled in white. (C) Binding pose of a new reported potent substrate resulting from a study on a homology model of LAT1 (Chien et al., 2018). The bottom panels (B, C) show the two-dimensional representation of the LAT1 interaction with its ligands.

