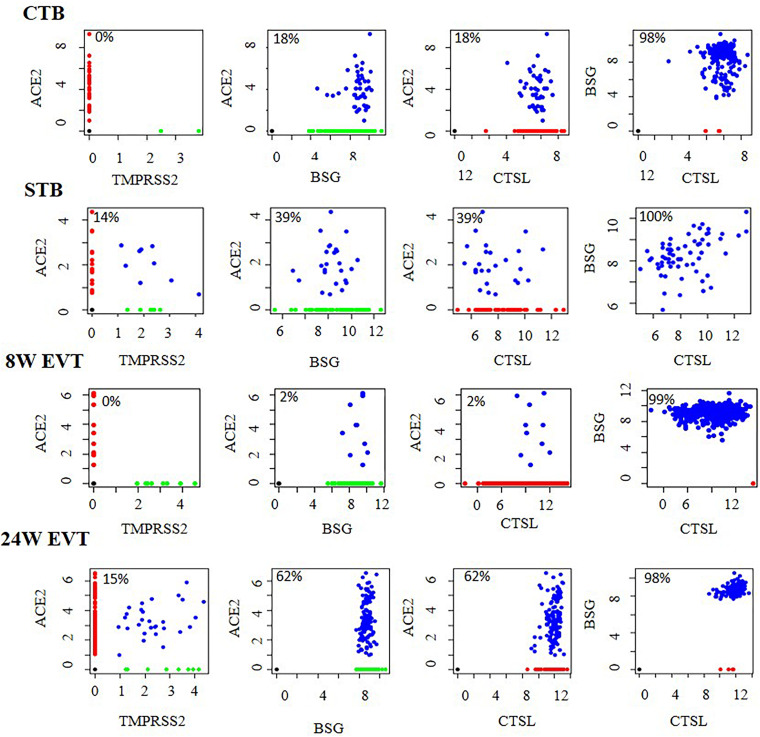
FIGURE 3.
Co-expression of mRNA of SARS-CoV-2 receptors and spike protein processing enzymes in human placental cells. Co-expression of ACE2 and TMPRSS2, ACE2 and BSG, ACE2 and CTSL, and BSG and CTSL in STB (n = 64), CTB (n = 248), first trimester EVT (8W EVT, n = 440) and second trimester EVT (24W EVT, n = 200). Each dot represents data of a single cell. Values in each box are the percentage of co-expressing cells. Co-expressing cells are blue; single-positive cells are red and green. X and Y axes represent log2 Transcripts Per Million (TPM) values for that gene. Data was extracted from single cell RNA-seq of human placenta (Liu et al., 2018) [Accession number GSE89497]. EVT, extravillous trophoblast; CTB, cytotrophoblast; STB, syncytiotrophoblast.

