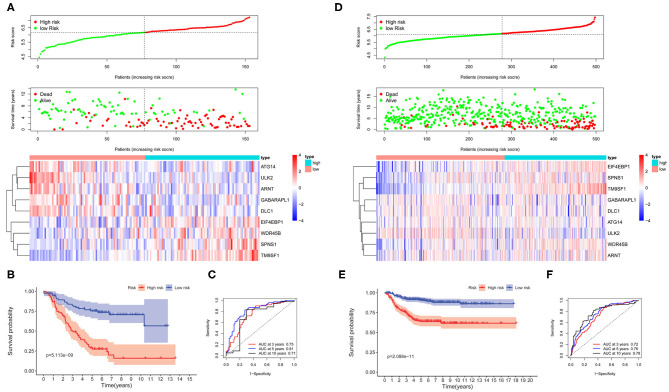
Figure 2.
The autophagy-related genes (ARGs) prognostic signature for neuroblastoma. (A) The distribution of risk scores, survival status of each patient, and heat map of ARG expression pattern in cohort 1. (B) Kaplan–Meier survival curve for overall survival (OS) of patients in the low-risk group and high-risk group for cohort 1. (C) Time-dependent receiver operating characteristic (ROC) curves for the prognostic value of the ARG signature in cohort 1. (D) The distribution of risk scores, survival status of each patient, and heat map of ARG expression pattern in cohort 2. (E) Kaplan–Meier survival curve for OS of patients in the low-risk group and high-risk group for cohort 2. (F) Time-dependent ROC curves for the prognostic value of the ARG signature in cohort 2.

