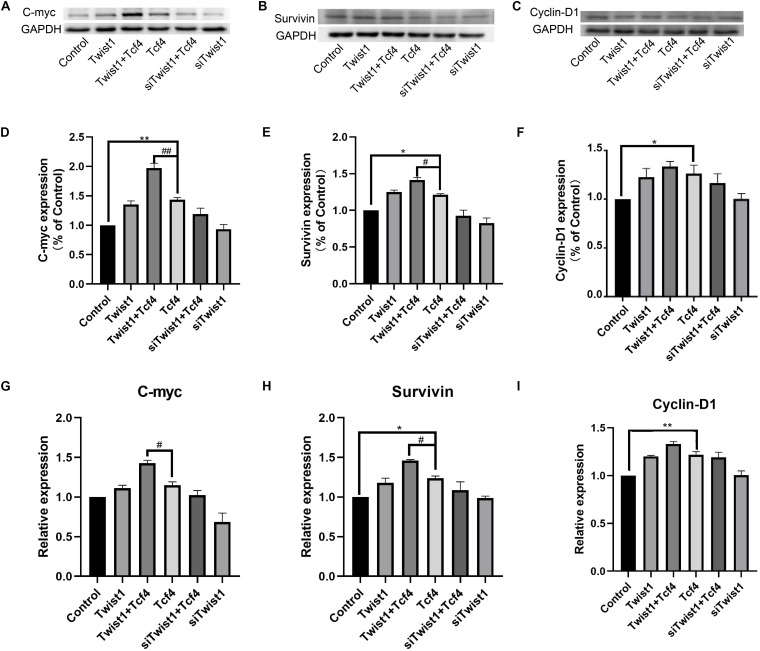
FIGURE 2.
The expression of Tcf4 target genes in DPCs treated with Twist1, Tcf4, and siTwist1. (A–C) Western blot results of c-myc, survivin, and cyclinD1. (D–F) Quantitative analysis of (A–C). The expression levels of target genes were standardized to that of GAPDH. (G–I) qPCR results of c-myc, survivin, and cyclinD1, the expression level of target genes was standardized to that of GAPDH. N = 3. #P < 0.05, ##P < 0.01 when compared with the Tcf4-treated group. *P < 0.05, **P < 0.01 when compared with the control group.

