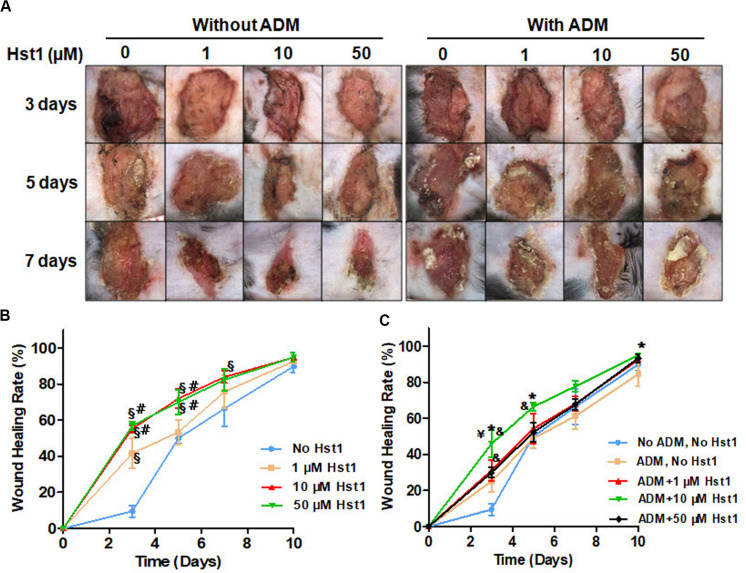
FIGURE 1.
3, 5, 7, and 10 days post-surgery, the dynamic changes of wound area in different groups after treatment. (A) Representative images of acute wounds showed that the wound area treated by 10 μM Hst1 was significantly smaller than the other groups; (B) The temporal changes of wound healing percentage (%) in each treatment group. On days 3, 5, and 10, the healing percentage of the wounds treated by 10 μM Hst1 was significantly higher than the control; (C) ADM + 10 μM Hst1 was associated with significantly higher healing percentage than the ADM and the control on days 3 and 5. Data were presented as mean ± SD. §: the 1, 10, 50 μM Hst1 group vs the control group; #: the 10, 50 μM Hst1 group vs the 1 μM Hst1 group; &: the 1, 10, 50 μM Hst1 + ADM group vs the control group; *: the 10 μM Hst1 + ADM group vs the ADM group. –Y: the 10 μM Hst1 + ADM group vs the 50 μM Hst1 + ADM group (P < 0.05).

