FIGURE 2.
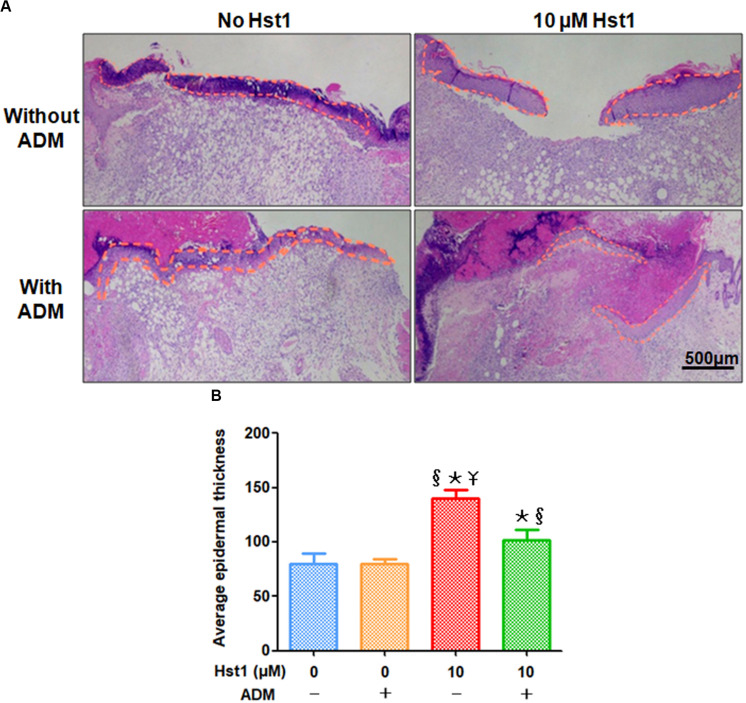
Histological evaluation of epidermal thickness at wound sites. (A) 7 days post-surgery, the newly formed epidermal in the 10 μM Hst1 group was thicker and cell stratification was more obvious. The yellow curve showed the epidermal regeneration area. The scale bar = 500 μm; (B) Quantitative analysis showed that the treatment with 10 μM Hst1 was associated with the highest thickness of newly formed epidermal layer, which was followed by ADM + 10 μM Hst1. In contrast, ADM alone didn’t promote epidermal thickness. §: The 10 μM Hst1 group and 10 μM Hst1 + ADM group vs the control group; *: The 10 μM Hst1 group and 10 μM Hst1 + ADM group vs the ADM group; –Y: The 10 μM Hst1 group vs the 10 μM Hst1 + ADM group (P < 0.05).

