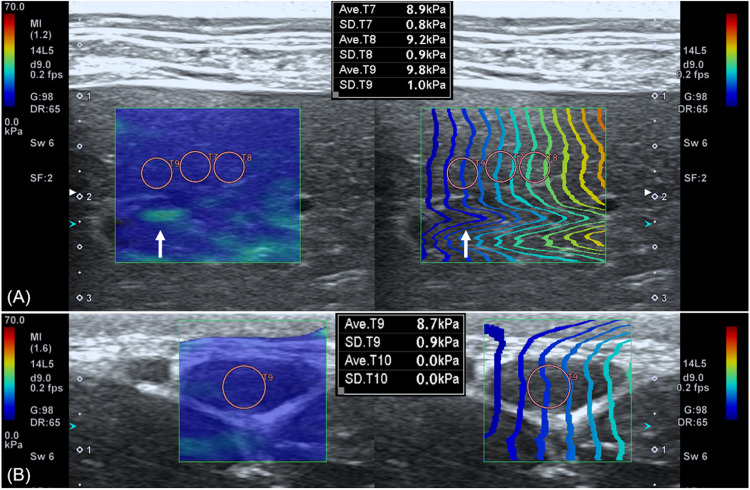
FIGURE 3.
Shear wave elastography in the liver (A) and submandibular lymph node (B). A dual-screen mode shows a color map on the left side and propagation map on the right of the view (rectangular boxes). On color maps, red color represents high shear wave velocity and blue low velocity. Propagation maps show multiple contour line depicting shear wave arrival time at different location. (A) In the liver, circular regions of interest (ROIs) with 3 mm diameter are placed over the region where uniform blue color on color map and parallel contour lines with constant interval on propagation map are observed. Care was taken not to place ROI over the region (arrow) displayed as green color in the color map and distorted contour line in the propagation map. (B) In the submandibular lymph node, a 2 mm diameter ROI not to exceed the target organ is used.

