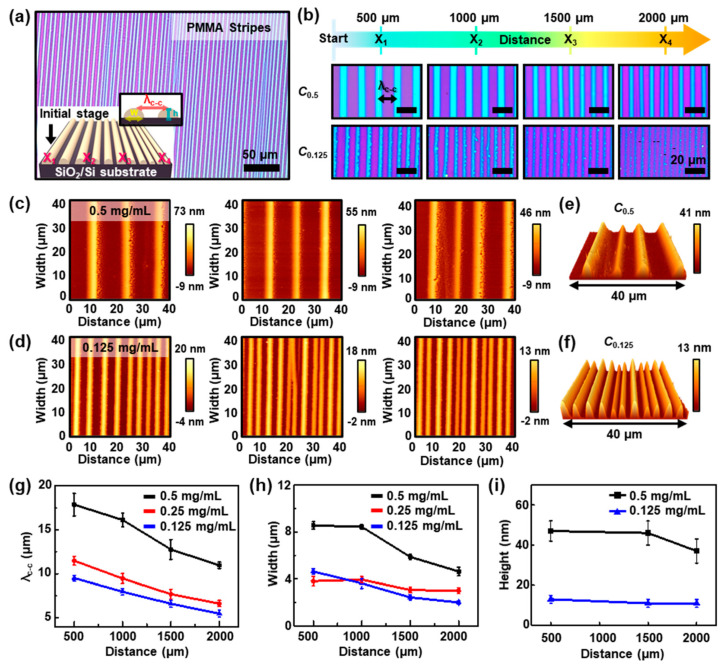
Figure 2.
(a) An optical micrograph of a highly regulated array of PMMA stripes on the SiO2/Si substrate with a concentration of 0.125 mg mL−1; the inset is the schematic drawing, in which the value of λc-c indicates the typical center-to-center distance between two adjacent stripes; X1, X2, X3, and X4 denote the distances of PMMA stripes away from the initial stage. (b) Optical micrographs of periodically patterned stripe arrays of PMMA with varied concentrations (C = 0.5 and 0.125 mg mL−1); the images were measured at the different locations; scale bars are 20 μm for all images. (c,d) Atomic force microscopy (AFM) images of the PMMA stripes formed on the SiO2/Si substrate, collected from the initial (left) to final (right) stages from concentration with 0.5 mg mL−1 and 0.125 mg mL−1, respectively. (e,f) The 3D topological AFM images from the concentration of 0.5 and 0.125 mg mL−1, respectively; the scan position was in 2000 μm (X4 region) with a size of 40 × 40 μm2. (g–i) The measured gradient values of λc-c, w, and h at different locations, depending on the concentration of the PMMA solution, respectively.

