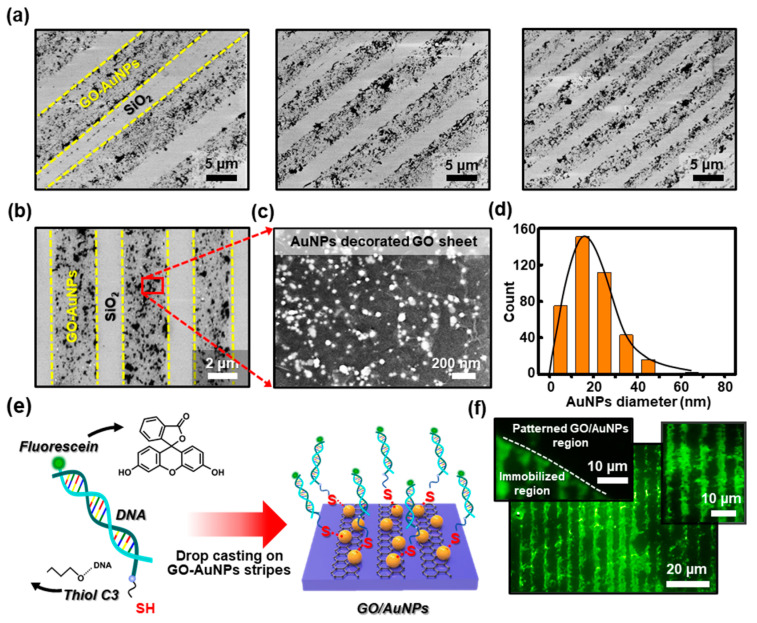
Figure 4.
(a) A set of scanning electron microscopy (SEM) images collected from the different locations, presenting close-packed arrays of GO/AuNP stripes formed on a substrate in a gradient fashion. (b) A representative SEM image of the stripe patterned GO/AuNPs arrays configured with sharp contrast. (c) A highly magnified SEM image of densely embedded AuNPs in GO sheets, corresponding to the surface of the marked area shown in (b). (d) Histogram of the diameter of the AuNPs distributed on the stripe patterned GO sheet. (e) Schematic illustration of the DNA immobilization on the stripe patterned GO-AuNPs. (f) Fluorescent micrograph from the surface of the immobilized DNA arrays (inset: the white dotted line indicates the boundary between the DNA immobilized and non-patterned region (left), and the locally zoomed-in image (right)).

