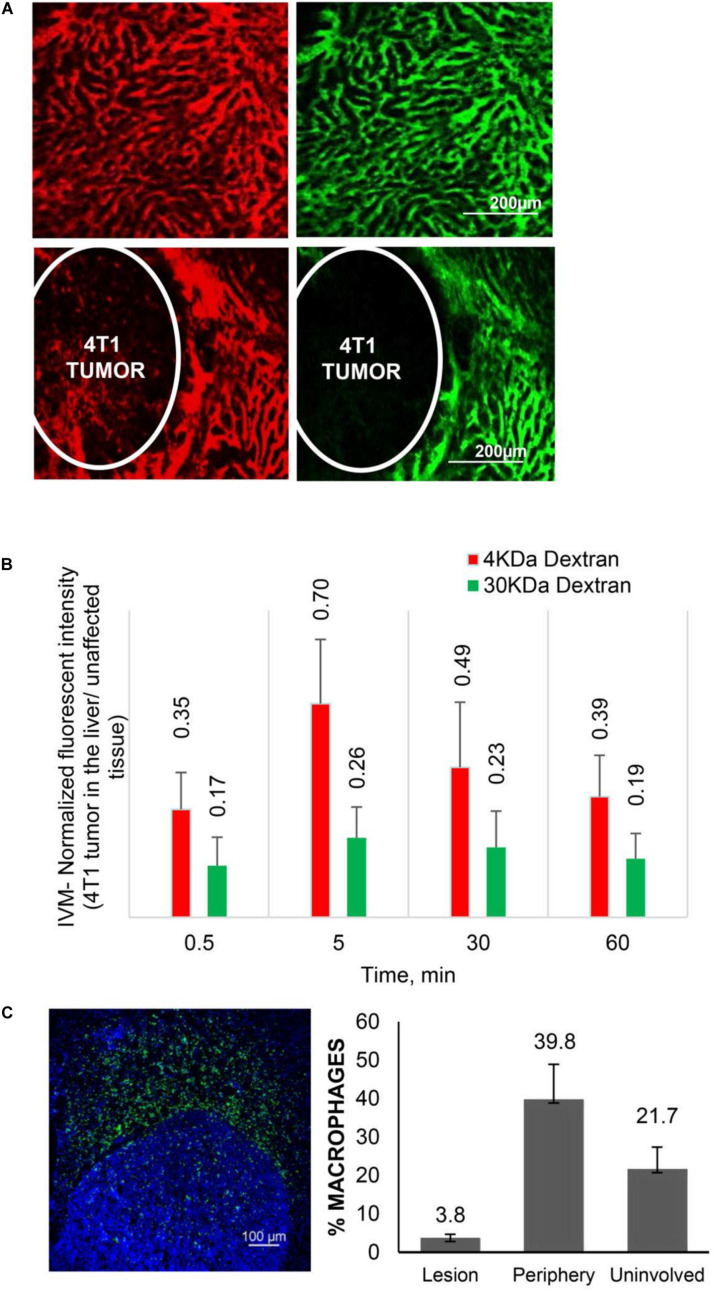
FIGURE 1.
Transport characteristics in breast cancer liver metastases. (A) Perfusion and diffusion of 3 KDa (red) and 40 KDa (green) fluorescent dextrans by IVM in normal liver (upper panels) and 4T1 breast cancer liver metastases after iv injection. (B) Fluorescent intensities of the dextrans in breast cancer liver metastases normalized to unaffected liver. (C) Distribution of Mϕ (F4/80 antibody, green) in breast cancer liver metastases. Number of Mϕ in the lesion, the periphery (40–50 micron from the tumor border) and unaffected liver is normalized to cell number detected by DAPI staining. Reprinted with permission from Tanei et al. (2016).

