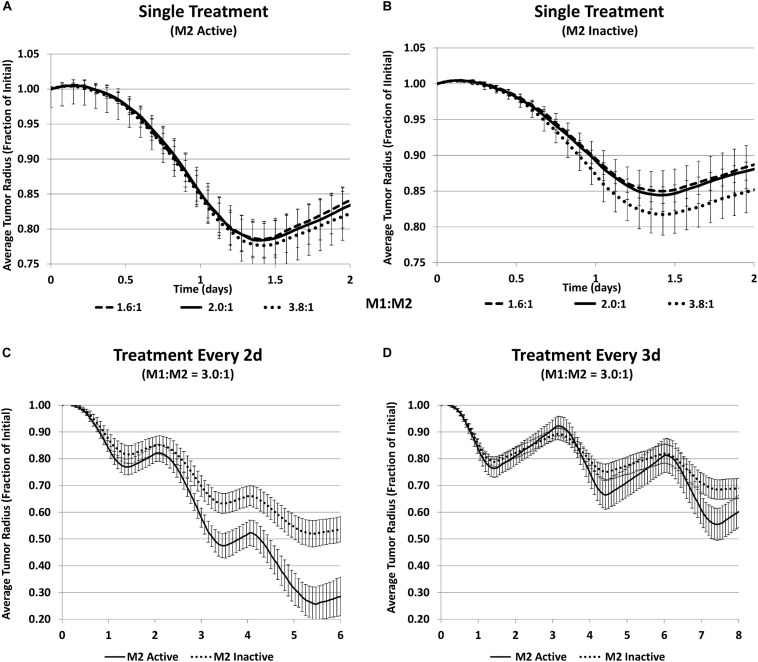
FIGURE 5.
Simulation of tumor progression for untreated and MSV-nAb-PTX treated cases including various combinations of macrophage polarizations simulated average tumor radius (n = 5, mean +/− SD) over time when treated with MSV-nab-PTX-loaded macrophages. (A) Single treatment with both M1 and M2 subtypes active for three different M1:M2 ratios; (B) single treatment with only M1 active for three different M1:M2 ratios; (C) treated every 2d with M1:M2 of 3.0:1; (D) treated every 3d with M1:M2 of 3.0:1. Reprinted with permission from Leonard et al. (2020).

