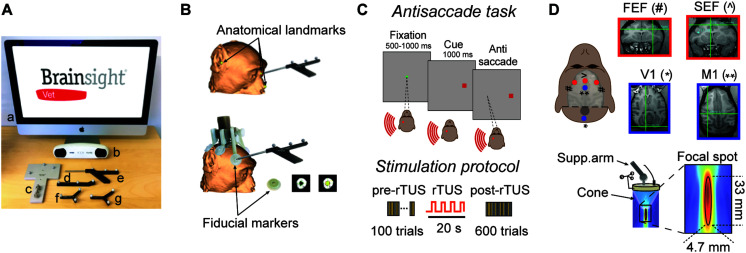
FIGURE 1.
Experimental set-up. (A) List of navigation tools to carry out a monkey registration: Brainsight computer (a), position sensor (b), calibration block (c), tool tracker (d), navigation pointer (e), subject tracker (f), and transducer tracker (g). (B) Subject registration. Top: registration can be based on facial landmarks which are defined as the bridge of the nose, the tip of nose and the notch above the tragus of the ears. Bottom: In the present study, we used fiducial markers which are fixed to the headpost of the subject resulting in higher co-registration accuracy between the subject and the MRI scan. These fiducial markers create hyperintensities on the MR images that are easily distinguishable. (C) Antisaccade paradigm. The animal starts the trial by fixating a central spot (green square) for 500–1000 ms. A peripheral cue (a red square at 16 degrees of eccentricity) is then presented either at the left or right of the visual field on the horizontal meridian for 1000 ms. The animal is rewarded by making an eye movement to the opposite location of the peripheral cue (antisaccade). The brain area stimulated by rTUS is indicated by the red circle (here, left FEF). Each animal practices a block of 100 trials before rTUS (pre-rTUS block) and then six post-rTUS trials. Each block contains 100 trials (50 right and 50 left) and lasts on average 5 min. The rTUS train lasts 20 s at a frequency of 10 Hz with stimulation pulses of 320 kHz. (D) Experimental set-up. The ultrasonic transducer is manually guided toward the Region of Interest (ROI) by a neuro-navigation system (Brainsight Vet). The cigar-shaped focal stimulation (bottom panel) targeted the FEF and SEF location [indicated by red dots: FEF (#) ans SEF (∧)]. We also performed sham stimulation sessions by placing the transducer over the primary motor or visual cortex [V1 (*) and M1 (**) indicated by blue dots]. The insets represent the MRI images used to locate ROI (red squares) and control areas (blue squares). The intersection of horizontal and vertical green lines in each quadrant indicates the point at which the focused ultrasound stimulations were directed.

