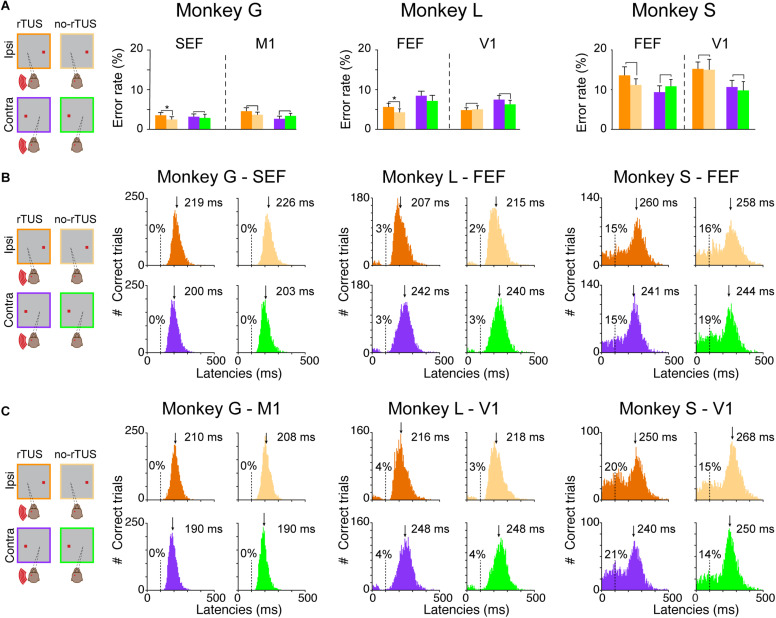
FIGURE 2.
Behavioral performances during the antisaccade task. (A) Percentage of error rates for all three animals (monkey G; left quadrant, monkey L; middle quadrant and monkey S; right quadrant). Each bar represents the mean error rates for the post-rTUS blocks for the different conditions (violet/orange for contralateral vs. ipsilateral antisaccades, respectively, and dark/light and violet/green for rTUS vs. no-rTUS, respectively). Error bars indicate the standard error of the mean (SEM). We compared rTUS vs. no-rTUS mean error rates for each condition using a Wilcoxon rank sum test (*p < 0.05). Note that the performance for all conditions (ROI, Control, Contra, and Ipsi) were similar (p > 0.05) for all three animals except for monkeys G and L who made significantly more errors when rTUS was directed toward FEF/SEF regions for ipsilateral antisaccades. (B,C) Antisaccade latencies (ms) for all conditions [Contra/Ipsi, rTUS/no-rTUS for each animal (Monkeys G, L, and S), when the transducer was directed toward the oculomotor (B) or the control (C) areas]. The latencies were pooled over the pre-stimulation block (practice) and the next six post-rTUS blocks for each condition. The percentages indicate the percentage of anticipated saccades (<100 ms, dashed lines) over the total number of trials for each condition. For each histogram, the downside arrow indicates the median latency (ms) with the cutoff of anticipations.

