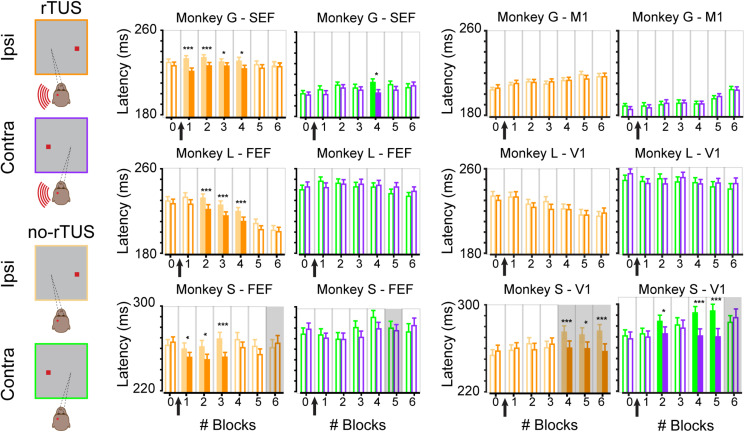
FIGURE 3.
Time course of rTUS effect on mean latencies. Mean latencies per block when rTUS was directed toward the oculomotor areas (SEF/FEF; two left columns) or the control areas (M1/V1; two right columns) in three animals (monkey G; top row, monkey L; middle row and monkey S; bottom row). Each bar represents the mean latency averaged over all successful antisaccades in each block of trials for each side (contra/ipsi), error bars indicate SEM. Open bars indicate non-significant differences (Wilcoxon rank sum test, p > 0.05); filled bars indicate significant differences (* for p < 0.05 and *** for p < 0.001, corrected for multiple comparisons). Gray backgrounds indicate when error rates were superior to 15% although light backgrounds indicate when error rates were inferior to 15%. Black arrows schematize when rTUS was performed between blocks #0 and #1.

