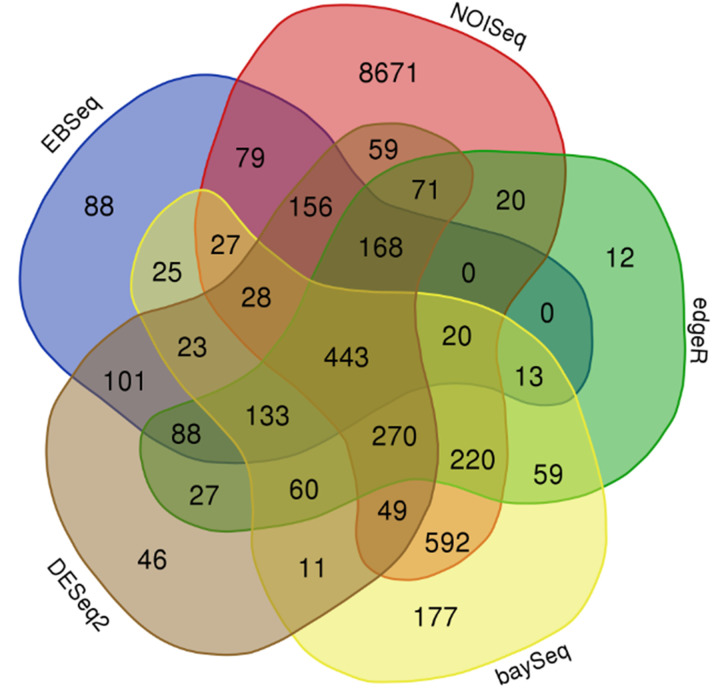
Figure 3.
Venn diagram which represents the consensus result obtained from Differentially Expressed Genes Analysis (DEGs) performed on P. mume, grouping the samples by genotype and using different statistical packages including NOISeq, edgeR, baySeq, DESeq2, and EBSeq. Three biological replicates and two technical replicates were assayed for each comparison of genotype and stage.

