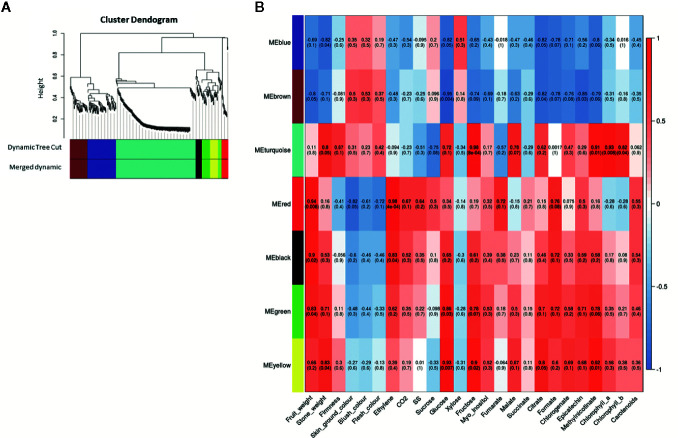
Figure 7.
Weighted correlation network analysis during apricot fruit ripening obtained with WGCNA R package. (A) Gene dendrogram and module colors obtained by average linkage hierarchical clustering where every leaf represents a DEG. The color row underneath the dendrogram shows the seven eigengene modules (ME) assignments determined by the Dynamic Tree Cut (threshold set for cut the dendrogram and obtain ME clustering). (B) Heatmap representation of the eigengene module-quality trait relationship for P. mume genotype contrast obtained when analyzing DEG expression and quantitative quality traits. Inside each module the Pearson correlation value is indicated and between parenthesis the p-value significance of its correlation. Three biological replicates and two technical replicates were assayed for each comparison of genotype and stage.

