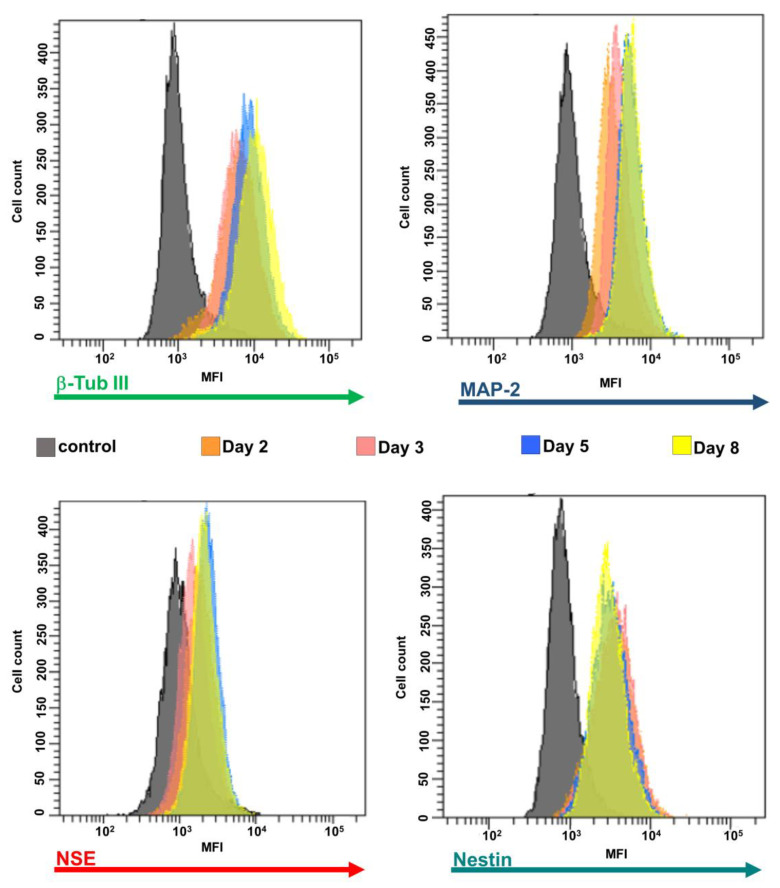
Figure 6.
Expression of the neuronal markers during differentiation process. A typical flow cytometry experiment with neuronal markers and hNCLs. Control cells (without antibodies) are shown as filled gray profiles and cells incubated with alexa-fluor®488 or 594 labelling for β-Tub III, MAP-2, NSE, or nestin are each indicated as different color profiles at the different stages of differentiation (i.e., 2, 3, 5, and 8 days).

