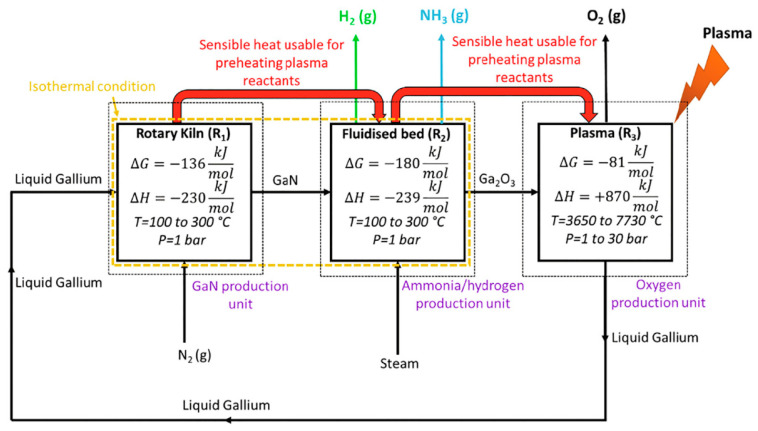
Figure 8.
Schematic diagram of the process for the coproduction of ammonia and hydrogen using a plasma-assisted process [37]. Reproduced with permission from M.M. Sarafraz, N.N. Tran, N. Pourali, E.V. Rebrov, V. Hessel, Energy Conversion and Management; published by Elsevier, 2020.

