
Figure 5.
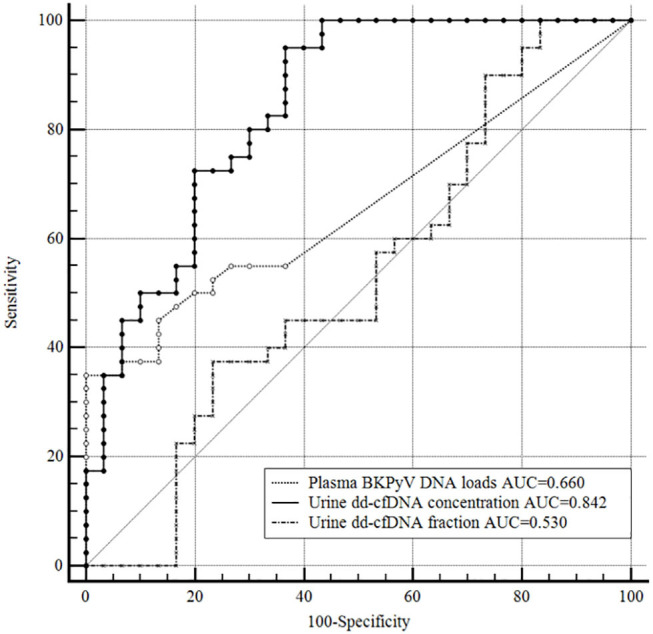
Receiver operating characteristic curves of the plasma BKPyV DNA load, urine dd-cfDNA and urine dd-cfDNA% for the discrimination of biopsy-proved BKPyVAN from biopsy-excluded BKPyVAN (probable BKPyVAN + possible BKPyVAN). The discrimination capacity of urine dd-cfDNA (AUC = 0.842) was superior to that of plasma BKPyV DNA load (AUC = 0.660, P = 0.010) and that of urine dd-cfDNA% (AUC = 0.530, P < 0.001). The discrimination capacity of urine dd-cfDNA% (AUC = 0.530) was inferior to that of plasma BKPyV DNA load (AUC = 0.660, P = 0.147).