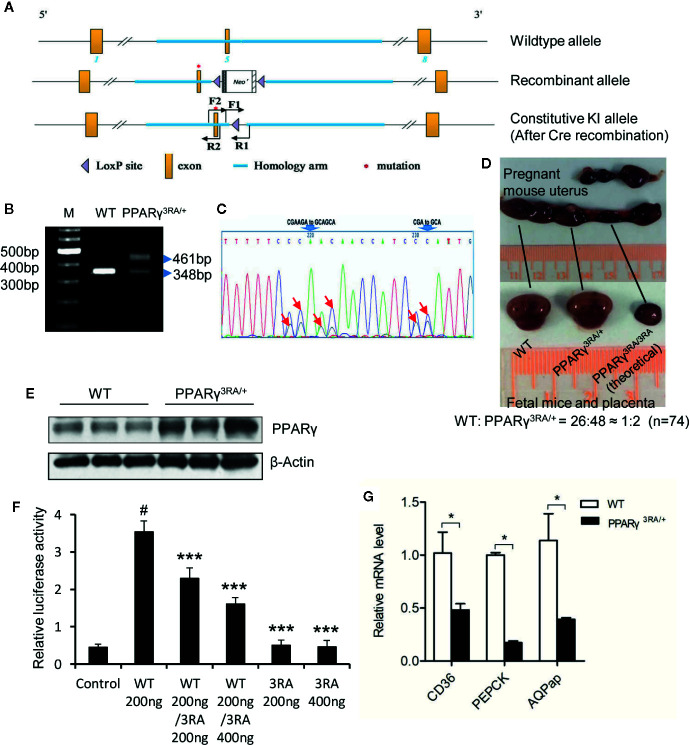
Figure 2.
Generation of PPARγ 3RA mutant mouse model. (A) Schematics of the targeting strategy. Top: WT allele. Middle: recombinant allele. Bottom: constitutive knock-in allele after Cre recombination. (B) Genotyping. Genomic DNA extracted from mouse tail was used for PCR with primer pair F1/R1. The PCR product with one band of 348 bp represents the WT PPARγ, and PCR product with two bands (348 bp and 461 bp) represents the heterozygotes. (C) Sequencing analyses of PCR product using primer pair F2/R2 verified the mutations in PPARγ gene. Heterozygotes show two peaks in the codes of Arg134, Arg135 and Arg138, where one peak indicates the allele of wild-type (CGAAGA and CGA), the other is 3RA mutant (GCAGCA and GCA). The mutated nucleotides were indicated by arrows. (D) Homozygous PPARγ 3RA mutant (PPARγ3RA/3RA) mice are embryonic death. Heterozygous pregnant (mate with a heterozygous male) was dissected, about a quarter of the fetal mice in the womb were absorbed by the mother, leaving only the placenta. The ratio of newborn cubs (homozygote/heterozygote) is about 1/2 when we calculated total 74 cubs (n=74). (E) The protein level of PPARγ in the fat tissues of WT and PPARγ3RA/+ mice. (F) In vitro reporter assay. HEK-293T cells were co-transfected with indicated quantity of WT and 3RA mutant pcDNA3.1-Flag-PPARγ plasmid together with PPRE-luc reporter plasmid. Empty pcDNA3.1-Flag vector was the control. Renilla was co-transfected as an internal control. 1 µM of rosiglitazone was added 5 h after transfection. Cells were harvested 24 h later for the luciferase assays. Experiments were performed in triplicate and repeated three times with similar results. Data show a representative experiment. Values are means ± SEM, #p<0.001 versus vector control, ***p < 0.001 versus WT 200 ng, one-way ANOVA followed by the Dunn’s test. (G) Relative mRNA level of PPARγ direct target genes in fat tissues of WT and PPARγ3RA/+ mice by quantitative RT-PCR. Experiments were repeated three times with similar results. Data show a representative experiment. Values are means ± SEM, n=6 per group. *p < 0.05 by Student’s t test.

