Figure 2.
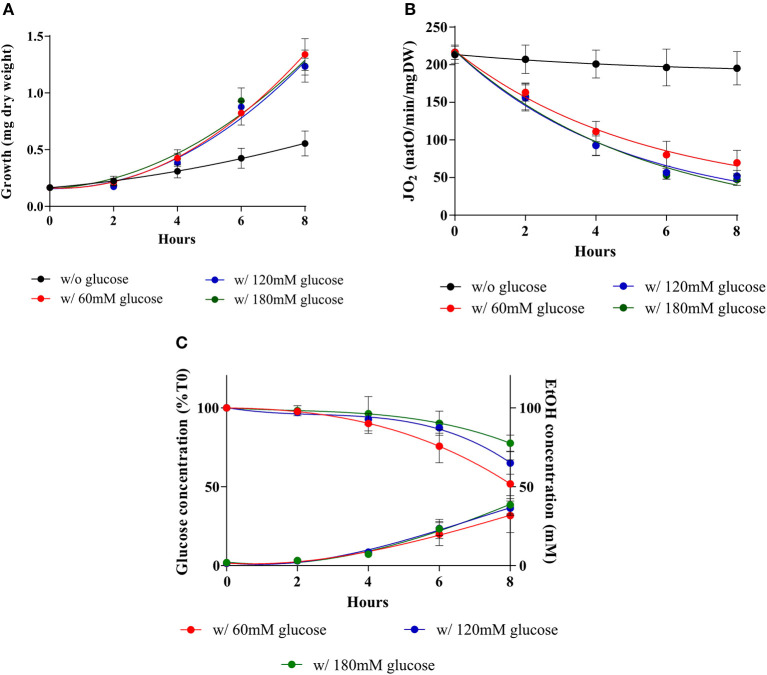
Induction of the Warburg effect in S. cerevisiae at various external glucose concentrations. S. cerevisiae growth medium was supplemented with 60 mM (), 120 mM (), 180 mM () of glucose or not (•) at T0. (A) For each condition, growth was followed for 8 h. Results shown represent means of at least seven separate experiments ± SD. (B) The respiratory rate was followed for 8 h. Results shown represent means of at least seven separate experiments ± SD. (C) After addition of the different glucose concentrations in the medium culture, glucose consumption and ethanol production were quantified. Results shown represent means of at least four separate experiments ± SD.

